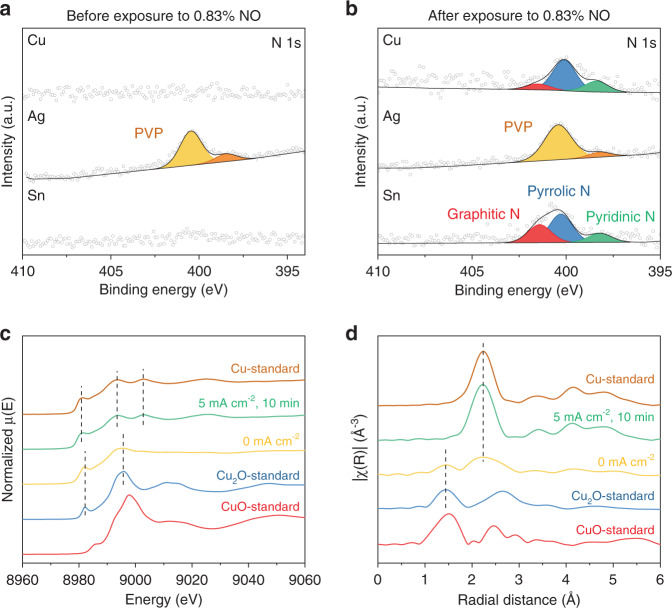
Fig. 5. Evaluation of the influence of NO on the catalyst structure.
XPS measurements of Cu, Ag, and Sn electrodes (a) before (t = 0 h) and (b) after exposure to 0.83% NO (t = 1 h) during CO2 electrolysis. Corresponding XPS data is provided in Supplementary Fig. 27 and Supplementary Table 15. Cu K-edge (c) XANES and (d) EXAFS spectra of spent Cu catalyst after exposure to 0.83% NO during CO2 electrolysis. Cu foil, Cu2O, and CuO were used as references.

