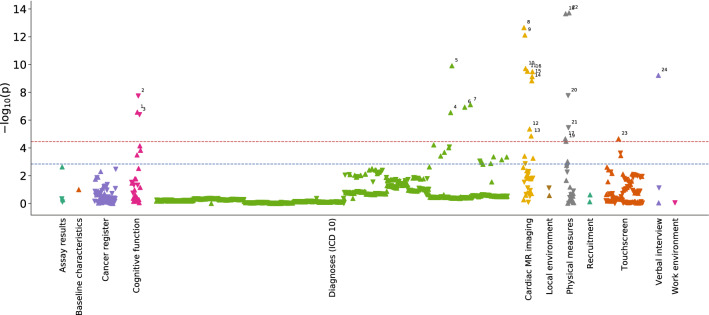
Figure 4.
Manhattan type plot showing the significance of association (p-value) between 1,410 UK Biobank traits and brain age difference, coloured by trait category. The Bonferroni-corrected significance threshold is marked by a horizontal red line (p-value = 2.35 × 10⁻⁵) and the 5% FDR correction threshold with a blue line (p-value = 1.45 × 10⁻³). More details on significant traits is found in Table 1. Trait label 1: Time taken to start entering values in symbol-digit matching test, 2: Number of symbol digit matches made correctly, 3: Number of symbol digit matches attempted, 4: Multiple sclerosis, 5: Essential (primary) hypertension, 6: Diagnoses—secondary ICD10: Type 1 diabetes, 7: Type 2 diabetes, 8: Systolic brachial blood pressure during pulse wave analysis (PWA), 9: Central systolic blood pressure during PWA, 10: Cardiac index during PWA, 11: End systolic pressure during PWA, 12: Stroke volume during PWA, 13: Central augmentation pressure during PWA, 14: Cardiac output during PWA, 15: Central pulse pressure during PWA, 16: Peripheral pulse pressure during PWA, 17: Ventricular rate, 18: Diastolic blood pressure, 19: Body mass index (BMI), 20: Hand grip strength (left), 21: Hand grip strength (right), 22: Systolic blood pressure, 23: Taking insulin, 24: Number of treatments/medications taken.

