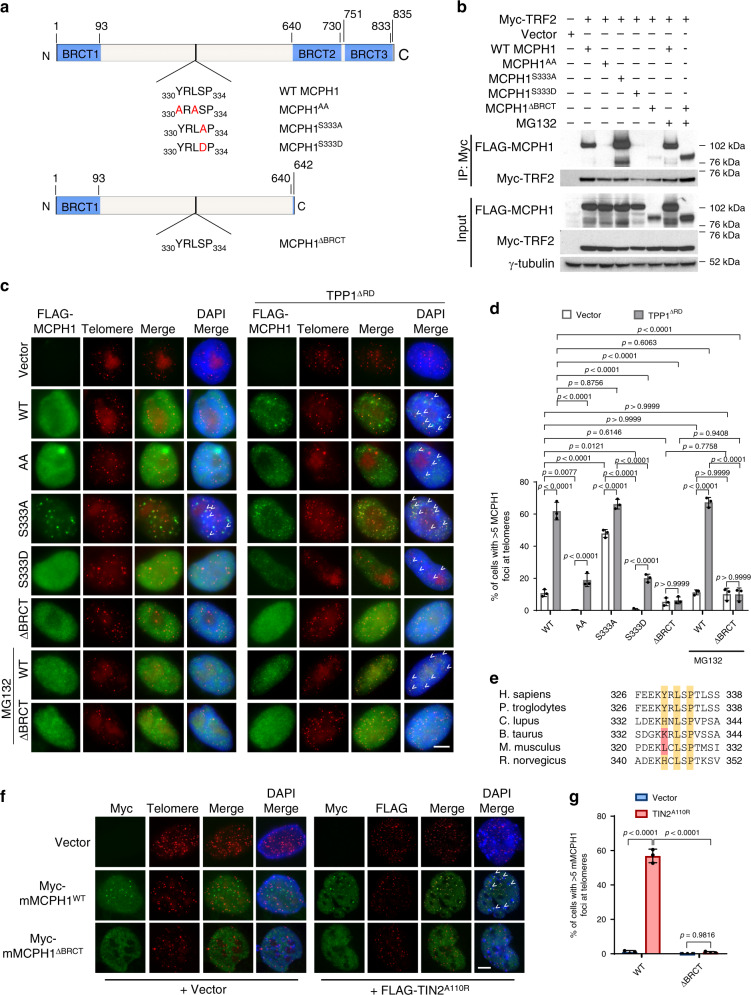
Fig. 2. MCPH1S333 phosphorylation modulates MCPH1–TRF2 interaction.
a Schematic representation of the human MCPH1 constructs generated. The TBM sequence for each construct is shown and amino acid substitutions are depicted in red. b Co-IP with anti-Myc antibody-conjugated agarose beads from lysates of 293T cells expressing Myc-tagged TRF2 and either FLAG-tagged WT MCPH1, FLAG-MCPH1TBM mutants or FLAG-MCPH1ΔBRCT. γ-tubulin was used as a loading control. The blot shown is representative of four independent experiments. c Immunostaining-PNA FISH in HeLa cells overexpressing either empty vector or one of the FLAG-tagged WT MCPH1, MCPH1AA, MCPH1S333A, MCPH1S333D, MCPH1ΔBRCT constructs and either empty vector or HA-TPP1ΔRD. MCPH1 proteins were detected using an anti-FLAG antibody (green) while telomeres were detected with a Cy3-OO-(CCCTAA)4 PNA probe (red). 4,6-diamidino-2-phenylindole (DAPI) was used to stain nuclei (blue). Representative images from three independent experiments are shown. White arrowheads indicate MCPH1 foci co-localizing with the telomere signals. Scale bar: 5 μm. d Quantification of the percentage of cells with >5 MCPH1-positive foci at telomeres from c. Data represent the mean ± standard deviation (SD) from three independent experiments. At least 200 cells were scored for each sample. Significance was determined with one-way analysis of variance (ANOVA) followed by Tukey’s multiple comparison test. P values are shown. e Comparison of MCPH1TBM amino acidic sequence across several mammalian species. The conserved residues are highlighted in yellow, while the residues in red differ from the canonical Y/H-X-L-X-P amino acid sequence. f Immunostaining-PNA FISH in MEFs overexpressing either Myc-WT MCPH1 or Myc-MCPH1ΔBRCT together with either empty vector or FLAG-TIN2A110R. Myc-MCPH1 proteins were detected with a Myc antibody (green), while telomeres were detected with either a telomeric PNA probe or a FLAG antibody that recognizes FLAG-TIN2A110R (in red). Nuclei were stained with DAPI (blue). Representative images from three independent experiments. Scale bar: 5 μm. g Quantification of the percentage of cells with >5 MCPH1-positive foci at telomeres from f. Data are representative of the mean of three independent experiments ± SD. A minimum of 200 cells for each sample were scored. Statistical analysis: one-way ANOVA followed by Tukey’s multiple comparison test.

