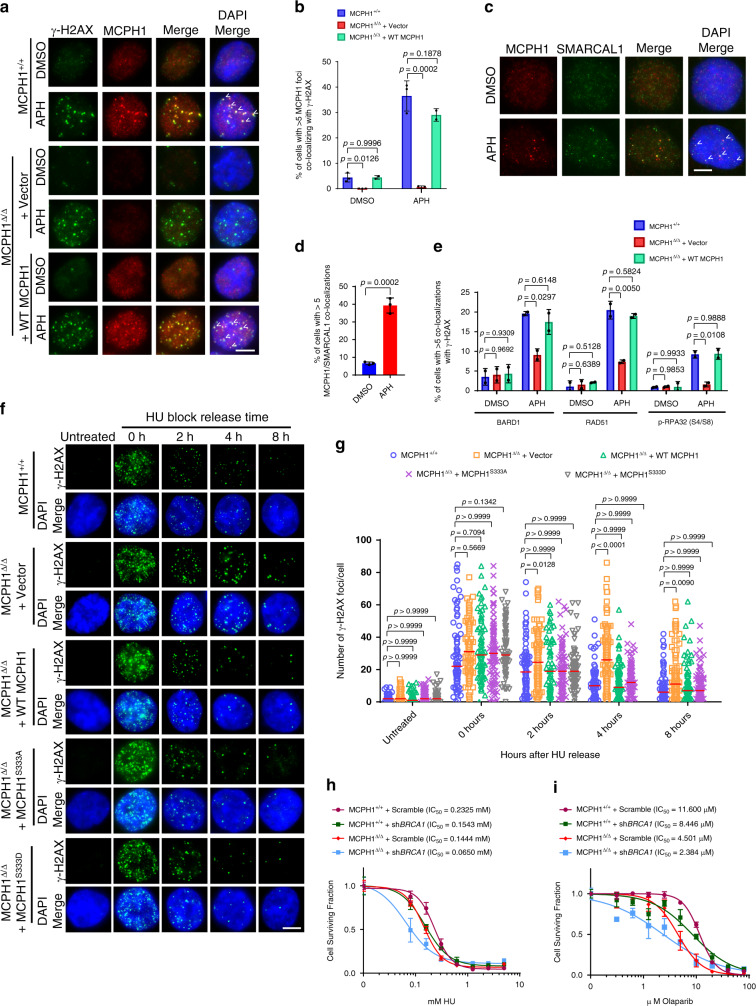
Fig. 6. MCPH1 is required for recruitment of HDR factors to stalled replication forks to promote fork restart.
a MCPH1 (red) and γ-H2AX (green) immunostaining in the indicated cells lines treated with either DMSO or 0.25 μM APH. Representative images from either three (MCPH1+/+ and MCPH1Δ/Δ + vector cells) or two (MCPH1Δ/Δ + WT MCPH1 cells) independent experiments. b Mean values ± SD of the percentage of cells with >5 MCPH1/γ-H2AX co-localizations from (a). n = 3 for MCPH1+/+ and MCPH1Δ/Δ + vector cells, n = 2 for MCPH1Δ/Δ + WT MCPH1 cells. At least 200 nuclei were scored. One-way ANOVA followed by Tukey’s multiple comparison test. c MCPH1 (red) and SMARCAL1 (green) immunostaining in U2OS cells treated with either DMSO or 0.25 μM APH. Representative images from three independent experiments. d Mean values ± SD of the percentage of cells with >5 co-localizing MCPH1/SMARCAL1 foci from (c). n = 3., at least 200 cells scored. Two-sided Student’s t test. e Percentage of cells with >5 BARD1, RAD51 or p-RPA32 (S4/S8) foci co-localizing with γ-H2AX in the indicated cell lines treated with either DMSO or 0.25 μM APH. Representative images are shown in Supplementary Fig. 8a. Data represent mean values ± SD, n = 2. At least 200 nuclei were examined. One-way ANOVA followed by Tukey’s multiple comparison test. f Representative images from two independent time course experiments to assess γ-H2AX foci (green) resolution in the indicated cell lines after release of HU block. Cells were incubated with 2 mM HU for 24 h before replacing the media and then fixed at the indicated time points. Untreated cells were used as control. g Number of γ-H2AX foci observed in 50–100 cells from each sample shown in (f). Data from one representative experiment. Red line: median. Kruskal–Wallis test followed by Dunn’s multiple comparison test. h, i Cell viability assay of MCPH1+/+ and MCPH1Δ/Δ cells treated with increasing amount of HU (h) or Olaparib (i), with or without concomitant BRCA1 depletion. Data from one of three independent experiments. Statistical significance is shown in Supplementary Table 1 (HU) and 2 (Olaparib). Scale bars for a, c, f: 5 μm.

