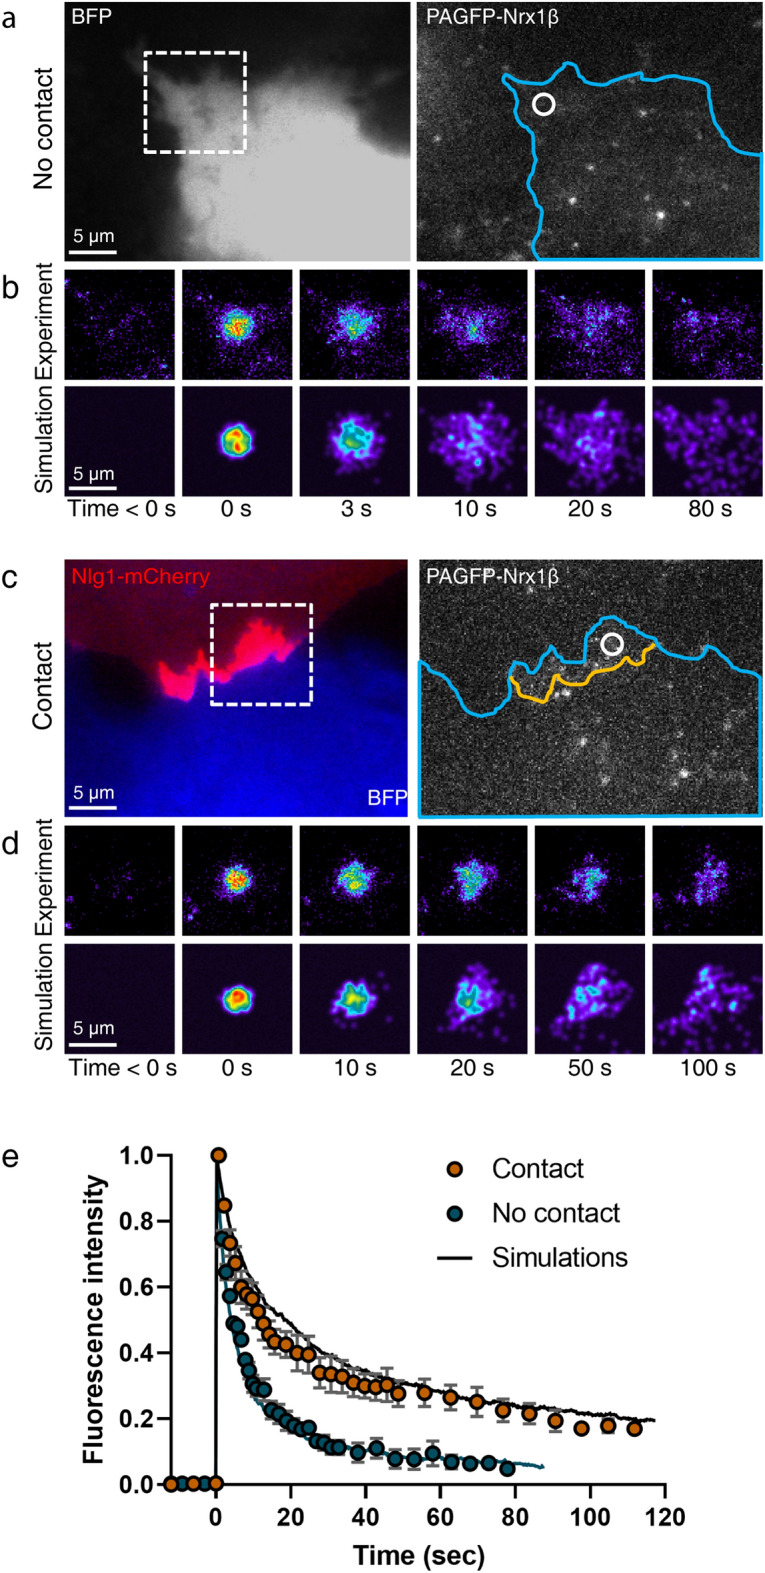
Figure 5.

Fitting PAF experiments. (a,c) Representative images of COS-7 cells co-expressing BFP (blue) plus PAGFP-Nrx1β, and either not forming contact, or forming contact with another cell expressing Nlg1-mCherry (red). The cell geometry (blue contour) is entered in the simulator, together with the contact region (yellow line). (b,d) Corresponding PAF sequences on zoomed areas (dashed squares), where the photoactivated spot is indicated in white (circle of diameter = 2.8 µm). The experimental and simulated images are shown on top of each other for the indicated time points. Fluorescence intensity is color coded. (e) Graph showing the fluorescence intensity normalized between 0 and 1 for PAF experiments performed outside (blue circles) or inside (orange circles) contact regions (mean ± sem of 5 cells/1 PAF region per cell, and 3 cells/2 PAF regions per cell, respectively). The corresponding simulations (solid curves) represent the average of 20 repetitions (sem < 2% mean, not shown). The Spearman correlation coefficients comparing experiment and simulation was r = 0.998 for contact regions, and r = 0.995 for outside regions (P < 0.0001, n = 32 time points in both conditions).
