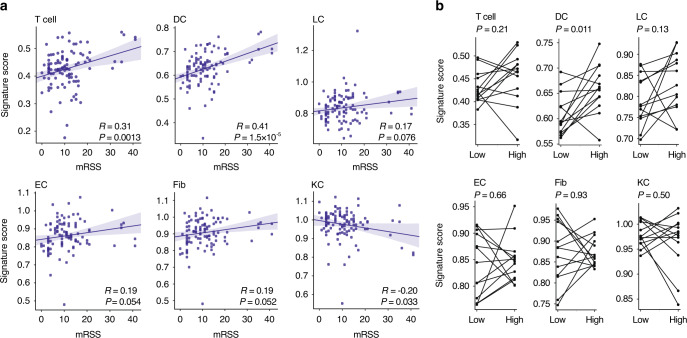
Fig. 3. Pathogenic effects of different cell types to SSc.
(a) Scatter plots showing the average expressions of the cell type signature genes (defined in HOMER) for T cells (CD4+ and CD8+ T cells), DC (dendritic cells), LC (Langerhans cells), EC (endotheliocytes), Fib (fibroblasts), KC (keratinocytes), versus the corresponding mRSS (modified Rodnan skin score) of the same patient at the same time point during the treatment. Gene expression profiles were obtained from patients’ affected skin cells via microarray, and genes responding to mycophenolate mofetil (MMF) treatment were discarded. The linear regression curve and 95% confidence interval (grey area) were also illustrated in each panel, two-tailed t-statistic P-value and coefficient (R) of Pearson’s correlation were shown in the bottom right. Source data are provided as a Source Data file. (b) Pair-wise comparison of the average expressions of cell type signature genes at time point with the lowest versus highest mRSS of the same patient for all the six-cell types measured. For each patient during the treatment, we identified the time points when the mRSS score is the lowest (time point Low) and highest (time point High), and then calculated the corresponding signature scores for each cell type from the microarray profiles at time point Low and time point High, respectively. The time points Low and High can be different for different patients. 13 patients whose highest mRSS - lowest mRSS > 5 were shown, P values were estimated by paired and two-tailed Student’s t test. Source data are provided as a Source Data file.

