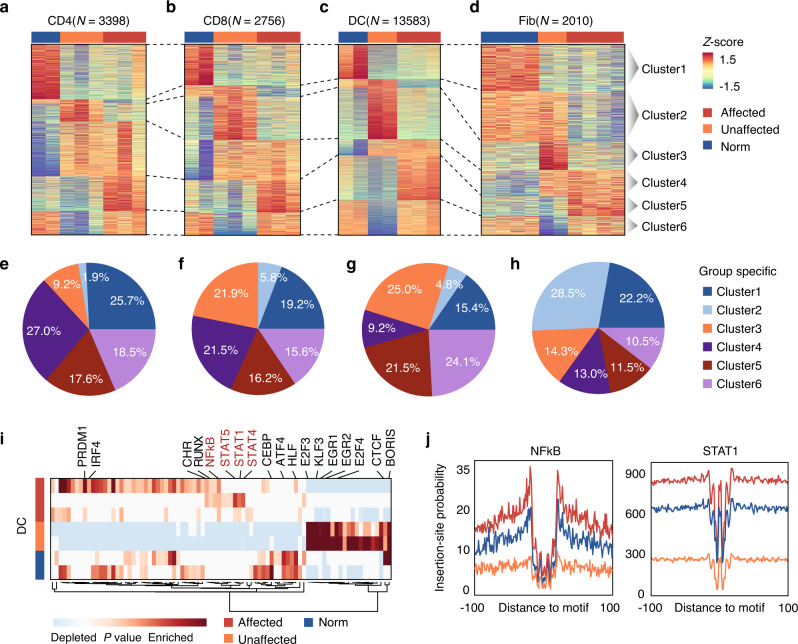
Fig. 4. Cell types-specific regulome divergence in normal, unaffected, and affected skins.
(a–d) Heatmaps of the normalized ATAC-seq intensities (z-scores) of peaks enriched in normal, unaffected and affected CD4 (CD4+ T cells) (a), CD8 (CD8+ T cells) (b), DC (dendritic cells) (c) and Fib (fibroblasts) (d). Cluster 1-6 represents the peak groups enriched in normal only, normal and unaffected, unaffected only, unaffected and affected, affected only, and normal and affected cells respectively. Each row is a peak and each column is a sample. Source data are provided as a Source Data file. (e–h) Ratios of peaks in each cluster compare with total number of significant differential peaks in CD4 (e), CD8 (f), DC (g), and Fib (h). (i) Enrichment of known transcription factor (TF) motifs in DCs isolated from healthy donors, and unaffected and affected skins from SSc patients. Source data are provided as a Source Data file. (j) Comparison of aggregate footprints for NFκB and STAT1 in DCs isolated from normal, unaffected or affected skins.

