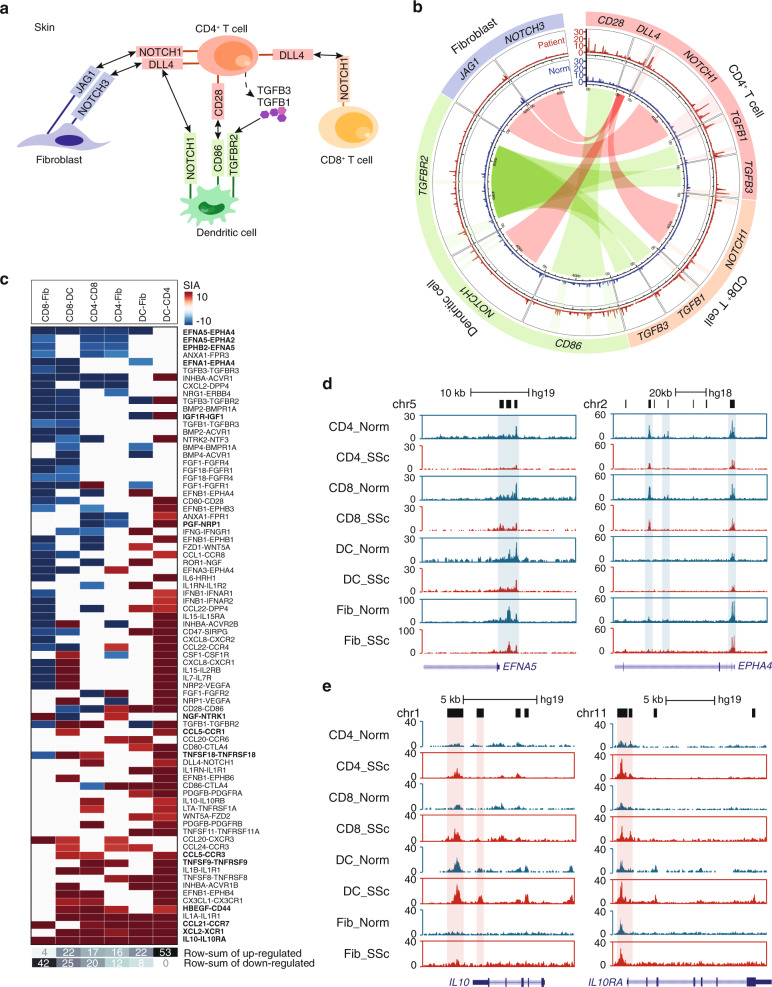
Fig. 6. Communications between skin resident cell in SSc compare to normal.
(a) Example diagram of the communications between dendritic cells, CD4+, CD8+ T cells, and fibroblasts through known and predicted SSc pathogenic receptors/ligands which were upregulated in affected skin compare to normal control. (b) Circos plot of the ATAC-seq signals around the receptors/ligands in (a) in normal versus affected skin from SSc patients. The outermost torus displays the names of the receptors and ligands in each cell type. The middle and inner torus display the ATAC-seq signals at these genes’ loci in SSc patients (middle) and healthy controls (inner) respectively. Gene loci that were more accessible in SSc cells were highlighted with shadow. Centre linkers connect the ligands and their receptors between cell types. The width of the linkers represents the length of the corresponding genes. (c) Strength of Interaction Alteration (SIA) for each pair of receptor/ligand up-regulated (red) or down-regulated (blue) in an affected state compared to the normal control. Novel receptor/ligand interactions in SSc were highlighted. The bottom rows display the total number of up-regulated and down-regulated receptor/ligand interactions between cell types. Source data are provided as a Source Data file. (d–e) Normalized ATAC-seq profiles of the normal vs affected CD4 (CD4+ T cells), CD8 (CD8+ T cells), DC (dendritic cells) and Fib (fibroblasts) at the EFNA5 and EPHA4 (d) and the IL10 and IL10RA (e) gene loci.

