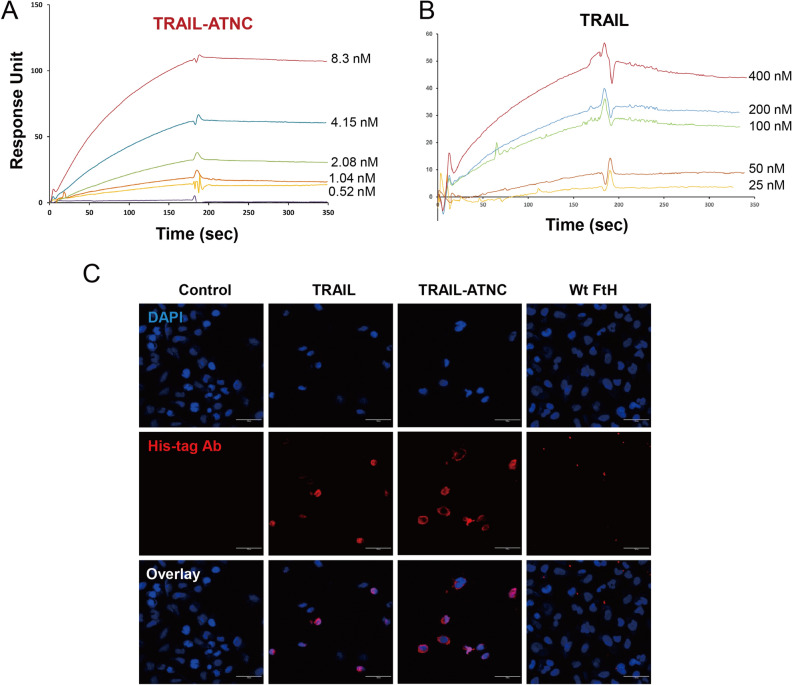
Figure 3.
Binding kinetics of TRAIL-ATNC with TRAIL receptor. (A,B) Surface plasmon resonance analysis for the binding kinetics of TRAIL and TRAIL-ATNC with TRAIL receptor (DR5). The concentrations of TRAIL (25–400 nM) and TRAIL-ATNC (0.52–8.33 nM) were injected to DR5 coated dextran-coated chips. (C) Representative fluorescence images of TRAIL, TRAIL-ATNC, and wild type ferritin (Wt FtH) bound to A549 cells, showing efficient cell binding of TRAIL and TRAIL-ATNC. A549 cells were treated with 50 nM of each protein for 1 h at 4 ℃ and immunostained with anti-His tag antibodies (red). Nuclei were counterstained with DAPI (blue). Scale bars: 30 µm.

