Figure 5.
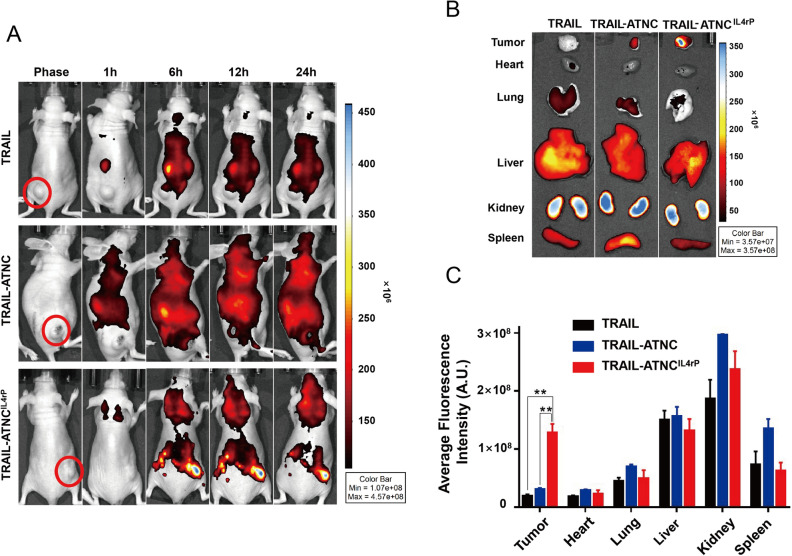
Bio-distribution of TRAIL, TRAIL-ATNC, and TRAIL-ATNCIL4rP. (A) Representative images of the bio-distribution of TRAIL, TRAIL-ATNC, and TRAIL-ATNCIL4rP. Mice bearing MDA-MB-231 tumor were intravenously injected with FPI774-labeled TRAIL, TRAIL-ATNC, or TRAIL-ATNCIL4rP followed by in vivo scanning by IVIS imaging system. Equal amounts of fluorescence of proteins were injected. (B,C) At 24 h post-injection, mice were sacrificed and organ/tissues were collected. Ex vivo bio-distribution was examined for TRAIL, TRAIL-ATNC, and TRAIL-ATNCIL4rP mice group. The average fluorescence intensity of each organ was measured (C). Data represent means ± SEM (**p < 0.01; T-test).

