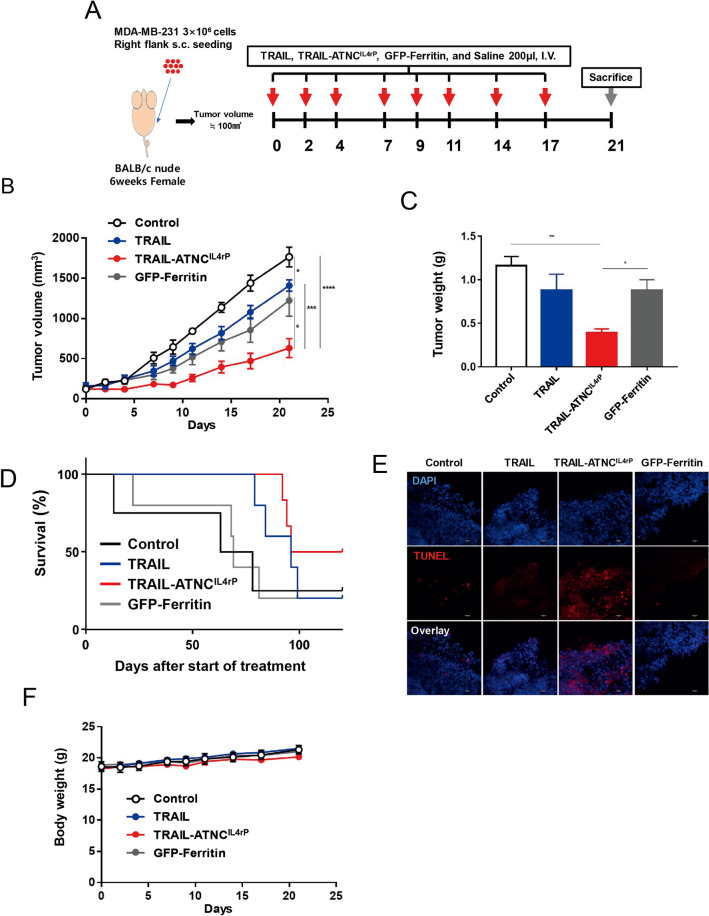
Figure 6.
Anti-tumor effect of the TRAIL-ATNCIL4rP in MDA-MB-231 tumor bearing mice. (A) Schematic diagram of MDA-MB-231 xenograft model experiment. MDA-MB-231 cells were injected subcutaneously to right flank of nude mice. After tumor volumes reached ~ 100 mm3, mice were treated with TRAIL-ATNCIL4rP (10 mg/kg, n = 6), GFP-Ferritin (10 mg/kg, n = 7), TRAIL (5 mg/kg, equivalent to the number of moles of TRAIL in a dose of TRAIL-ATNCIL4rP, n = 7), or saline, pH 7.4 (control, n = 5) eight times every 2 or 3 d via intravenous injection. (B) Tumor growth rate in mice treated with the TRAIL-ATNCIL4rP, TRAIL, GFP-Ferritin, and saline. (C) Weights of excised tumors from each group at 21 d post-injection. Data represent means ± SEM (*p < 0.05, **p < 0.01, ***p < 0.001, and ****p < 0.0001; T-test) (B,C). (D) Kaplan–Meier survival curves after start of treatment. (E) Representative images of apoptotic cells, which were determined using TUNEL assays, in tumor sections from mice treated with TRAIL-ATNCIL4rP, TRAIL, GFP-Ferritin, or saline (control) (Scale bars: 30 µm). (F) The body weight change of each group during anti-tumor therapy.

