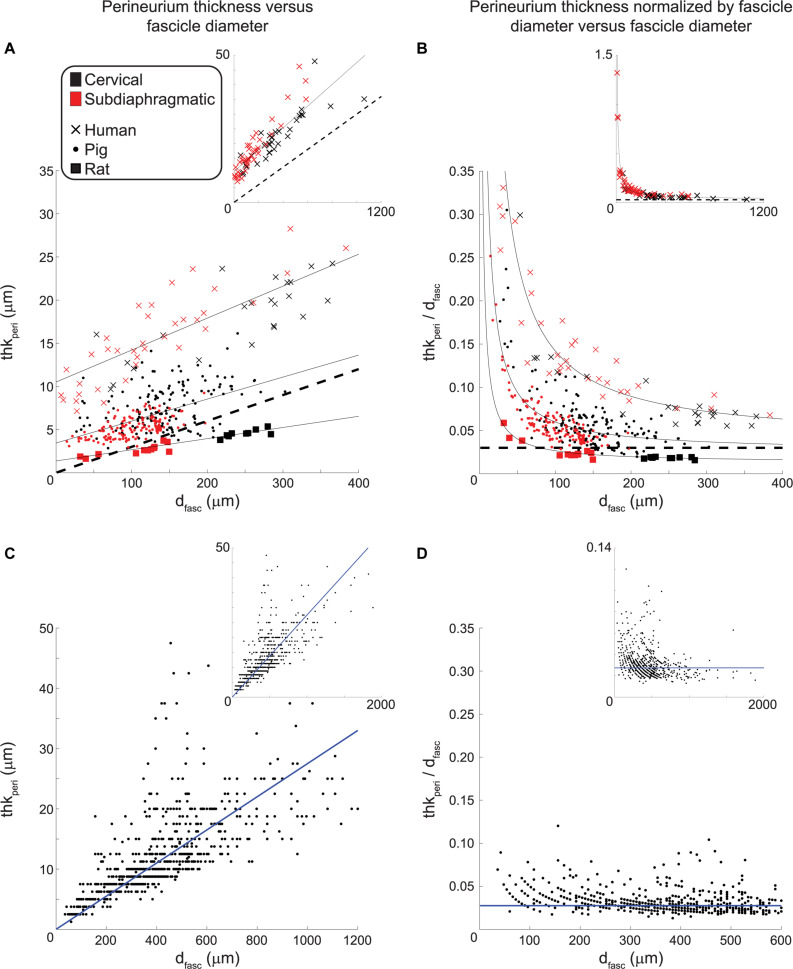
FIGURE 9.
Perineurium thickness (left) and perineurium thickness normalized by fascicle diameter (right) plotted as functions of effective fascicle diameter for our VN data (top) and the somatic nerve data in Sunderland and Bradley (1952) (bottom). The black dashed lines in the top row indicate a perineurium thickness that is 3% of the fascicle diameter, as found in Grinberg et al. (2008) by analyzing the data from Sunderland and Bradley (1952). The solid black lines indicate the fits for each species (Eqs. 1–3). The human and pig data exclude cases where there is more than one inner perineurium boundary for a given outer perineurium boundary (i.e., peanut fascicles) as the perineurium thickness is not a well-defined metric in those cases. For the human anti-claudin-1 IHC micrographs, the cervical level had 60 fascicles total (inner perineurium traces) of which 27 were intrafascicular bundles in 10 peanut fascicles; the subdiaphragmatic level had 44 fascicles total (inner perineurium traces) of which 4 were intrafascicular bundles in 2 peanut fascicles. For the pig anti-fibronectin IF micrographs, the cervical level had 210 fascicles total (inner perineurium traces) of which 57 were intrafascicular bundles in 25 peanut fascicles; the subdiaphragmatic level had 179 fascicles total (inner perineurium traces) of which 48 were intrafascicular bundles in 19 peanut fascicles. We fit the data from Sunderland and Bradley (1952) with a linear equation with forced zero intercept (Eq. 4). Note that the main plots in panels (A) and (B) do not show all human data (see insets), and the inset in panel (C) excludes two outliers at fascicle diameters of 630 and 1590 μm with corresponding perineurium thicknesses of 62.5 and 100 μm. All original data are available at Pelot et al. (2020a, g, b).

