FIGURE 2.
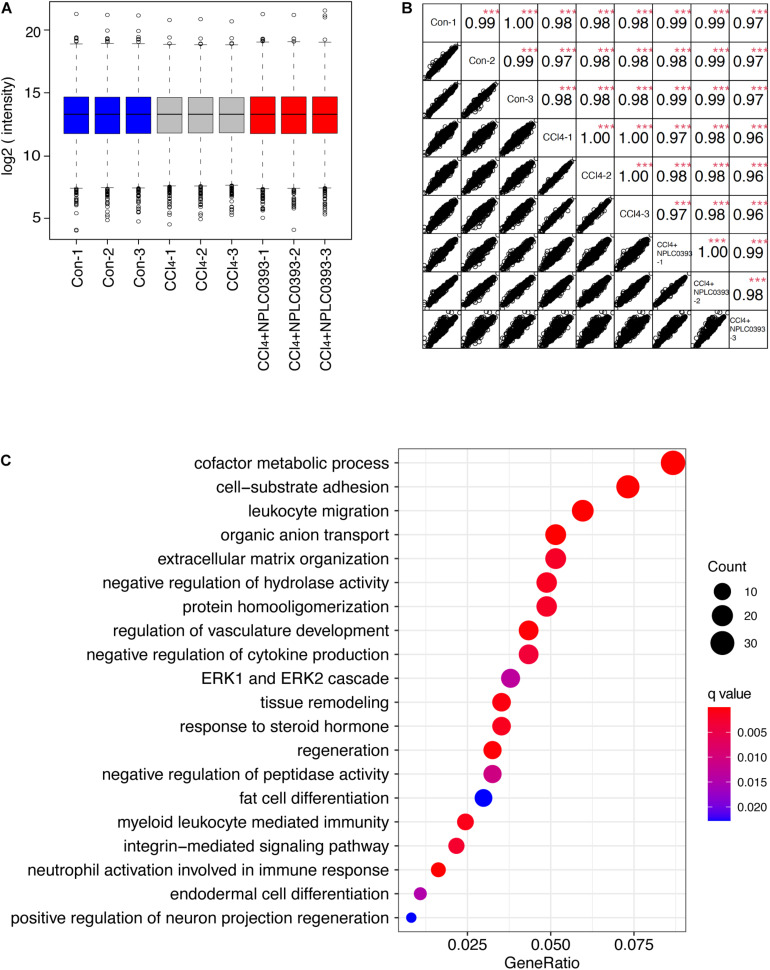
Identification of potential target of NPLC0393 by bioinformatic analysis. (A) Boxplots analysis of protein intensity across all samples. (B) Correlation analysis between each two samples. Rows and columns represent samples, and each square shows the correlation coefficients (Spearman r) between two samples. ***P < 0.001 comparing intensity of each two samples. (C) GOBP enrichment analysis of the differentially expressed proteins. Values are expressed as GeneRatio and color scale bar indicates adjusted P-value. Node size is proportional to the number of genes associated with the GO category.

