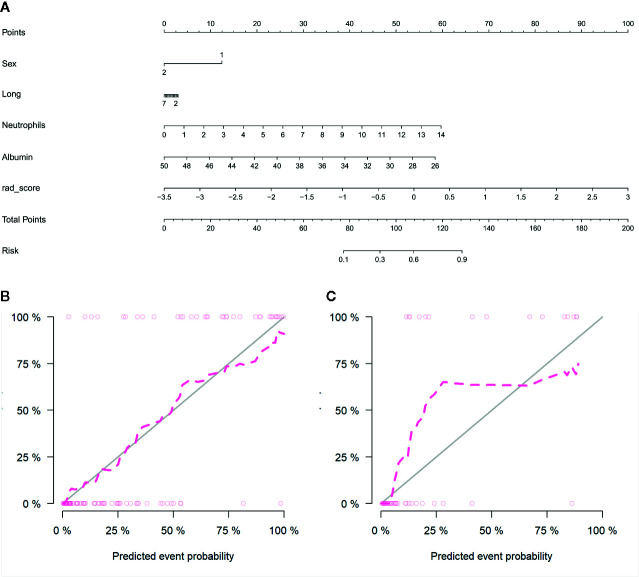
Figure 6.
Radiomics nomogram developed with receiver operating characteristic (ROC) curves and calibration curves. (A) The radiomics nomogram, combining sex, tumor maximum diameter, neutrophils, albumin, and Rad-score, developed in the training set. The nomogram calibration curves in the training (B) and validation (C) sets. Calibration curves indicate the goodness-of-fit of the model. The closer the pink line approaches the gray line, the better agreement between the predictive probabilities and the observed probabilities.

