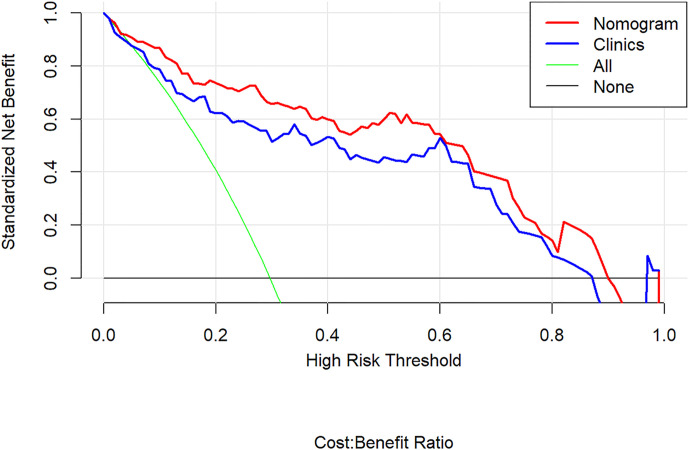
Figure 8.
Decision curve analysis for the radiomics nomogram. The y-axis shows the net benefit; x-axis shows the threshold probability. The red line and blue line represent the net benefit of the radiomics nomogram and the clinical factor model, respectively. The green line indicates the hypothesis that all patients had aggressive clear cell renal cell carcinoma (ccRCC). The black line represents the hypothesis that no patients had aggressive ccRCC. The decision curves indicate that the application of radiomics nomogram to predict aggressive ccRCC adds more benefit than treating all or none of the patients, and clinical factor model, across the full range of reasonable threshold probabilities.

