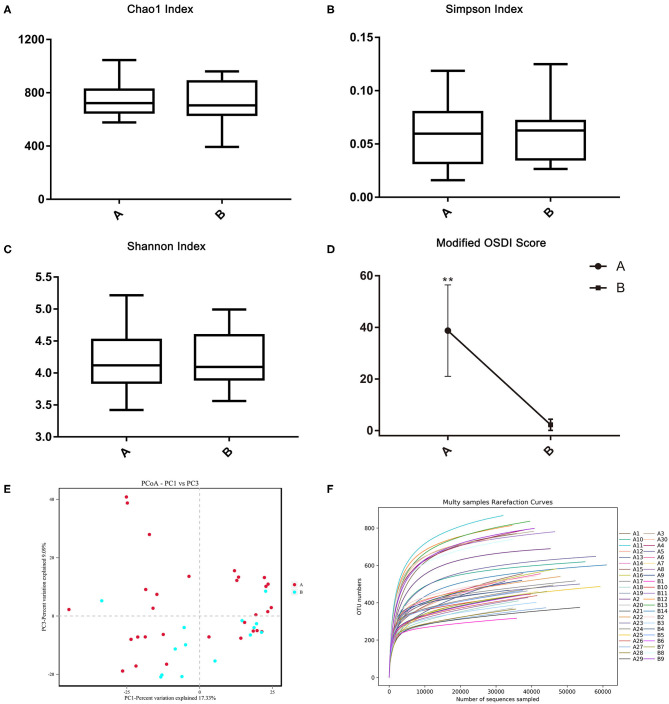
Figure 2.
The alpha and beta diversities between the demodex blepharitis patients and healthy controls. The Chao1 (A), Simpson (B), and Shannon index (C) representing the alpha diversity. The principal coordinate analysis was constructed using the Bray-Curtis method (E). Modified OSDI scores of patients with and without demodex blepharitis. The modified OSDI scores of the demodex blepharitis patients were significantly higher than those of the healthy controls (**p < 0.05) (D). The multi-samples refraction curves. Steep slopes of the rarefaction curves of individual samples (F).

