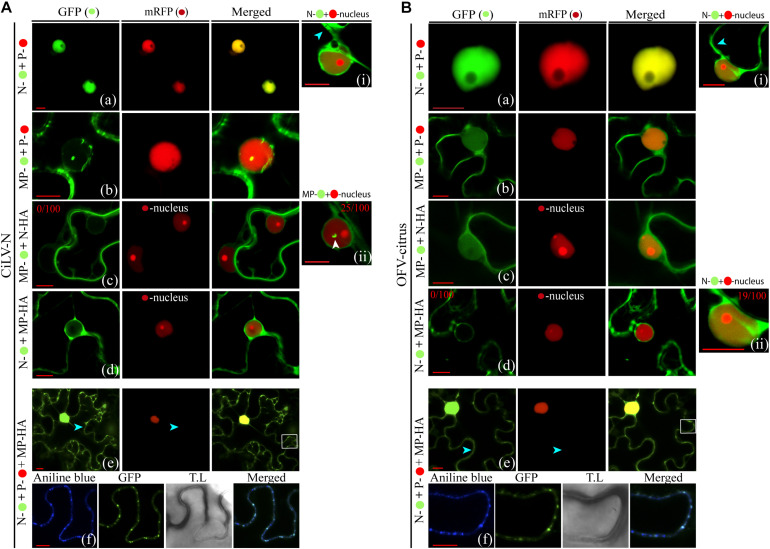
FIGURE 5.
Redistribution of the N protein from the N-P complex to the cell periphery and plasmodesmata upon co-expression with the MP. Confocal imagens of CiLV-N and OFV-citrus Ns- , Ns-HA, Ps-
 , MPs-
 and MPs-HA transiently co-expressed in N. benthamiana leaves visualized at 48–72 h post-infiltration. The protein pair combinations performed among these constructions are: N-
 + P-
+ P- (Aa,Ba), MP-
 + P-
+ P- (Ab,Bb), MP-
 + N-HA +
  -nucleus marker (Ac,Bc), N-
 + MP-HA +
  -nucleus marker (Ad,Bd), and N-
 + P-
+ P- + MP-HA (Ae,Be). Blue arrows indicate GFP signal in the cytoplasm and white arrows indicate the GFP signal into the nucleus. The numbers at the top of Ai, Ac, Aii, Bd, and Bii panels corresponds the number of nuclei visualized expressing the correspondent protein fused to GFP from 100 counted nuclei. White boxes correspond to high magnification to highlight callose deposits stained with aniline blue (
 ) along the cell periphery (Af,Bf). All images displayed are representative of at least three independent experiments. Bars correspond to 10 μm.

