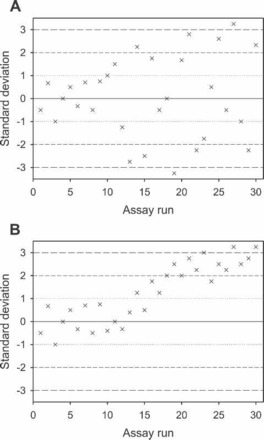
Figure 7.

Levey-Jennings charts showing the mean value of a single control result (ordinate) versus the assay run number (abscissa). (A) shows increased dispersion (random error) in control results after assay run number 10, and (B) shows a bias or trend in the control data after assay run number 13 (systematic error).
