
Figure 1B.
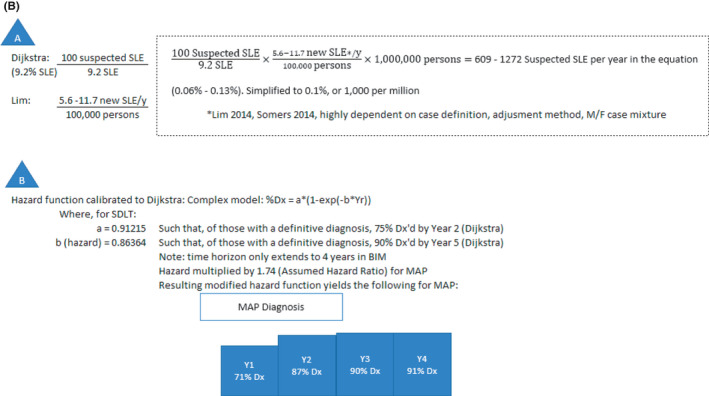
Calculation of 0.1% suspected SLE rate and diagnosis rates in years 1‐4 for MAP and SDLTs
- Dijkstra et al (4) reports 9.2% SLE prevalence among those suspected of having SLE, Lim et al (2) and Somers (3) report 5.5 to 11.7 new cases of SLE per year per 100 000. The inverse of Dijkstra’s estimate was multiplied by Lim’s estimated values and applied to a commercial payer population of 1 000 000 enrollees, giving a range of 0.06% to 0.13% suspected SLE prevalence through a factor‐label calculation. This was simplified to 0.1% suspected SLE prevalence.
- Coefficients a and b of the hazard function–based model (% diagnosed = a × (1‐exp(‐b × year)) were estimated by calibrating to definitive diagnosis data from Dijkstra et al (4) (ie, 75% diagnosed by year 2 and 90% diagnosed by year 5). This yields simultaneous equations: 0.75 = a × (1‐exp(‐2b)) and 0.90 = a × (1‐exp(‐5b)), which, when solved using Excel Solver, yield a = 0.91215 and b = 0.86364.