
Fig. 1.
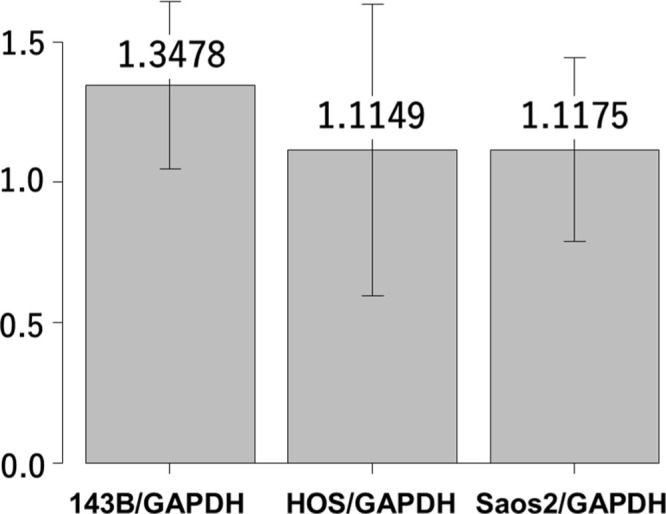
Reverse transcription real time quantitative-polymerase chain reaction (RT-qPCR) analysis showing interleukin-6 (IL-6) gene expression in 143B, HOS, and Saos-2 cells. Y-axis indicates the relative ratio of messenger RNA (mRNA). GAPDH, glyceraldehyde 3-phosphate dehydrogenase.