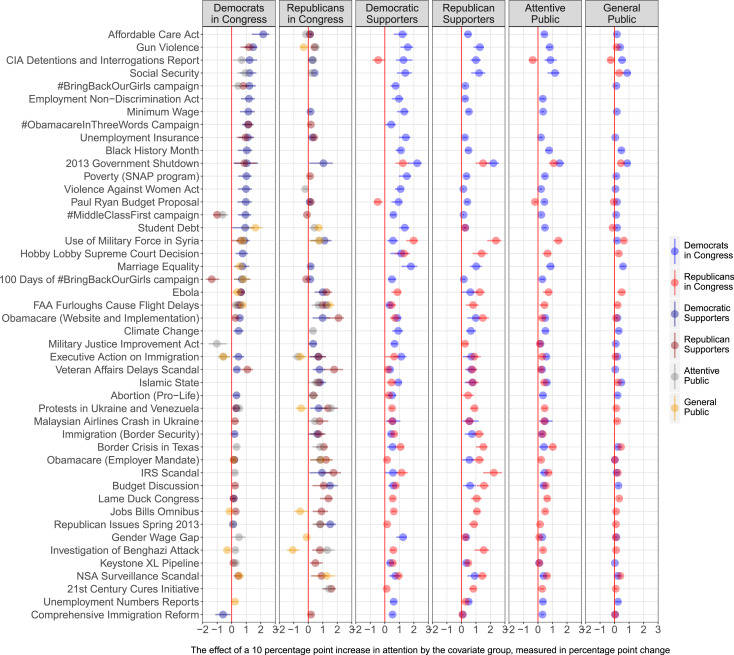
FIGURE 4.
Predicted Issue Responsiveness Across Issues and Groups (15 Day IRFs)
Note: The coefficients (with95%confidence intervals) indicate (in percentage points) how much more/less cumulative attention the groups in the panel titles paid to the issue in the y-axis as a result of a group (identified by the color) increasing the cumulative attention to the same issue by 10 percentage points 15 days ago. Only coefficients not crossing zero have been included. The two left-most panels show the influence of the public on Members of Congress. The four right-most panels show the influence of Democratic and Republican members of Congress on the public. Versions of this figure that also show the coefficients crossing zero are available in Online Appendix C.

