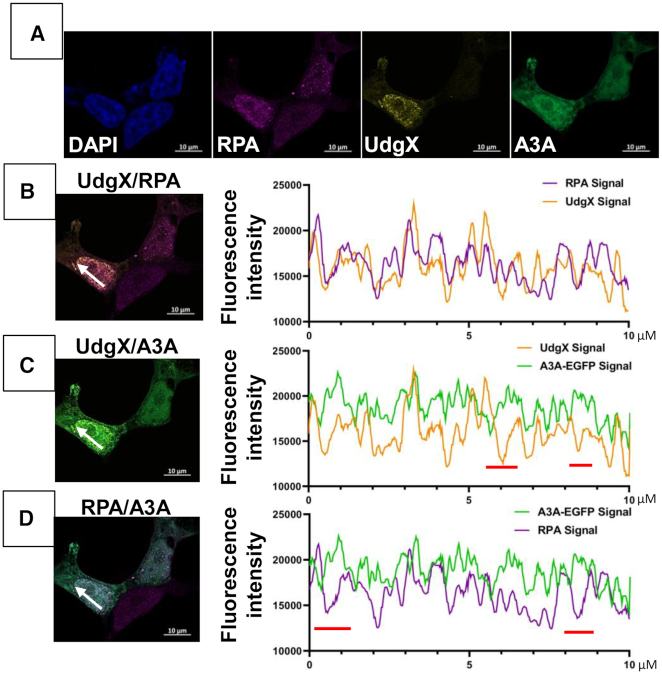
Figure 6.
Distribution of UdgX, RPA and A3A in cisplatin treated HEK293 cells. (A) The cells were treated with cisplatin and transfected with pA3A-EGFP and pFLAG-UdgX, fixed and stained with DAPI and appropriate antibodies. Fluorescence image shows distribution of DAPI (blue), A3A (green), RPA (pink) and UdgX protein (yellow). (B) through (D) Individual channels were overlaid two at a time and an intensity profile was defined over 10 μm (panels on the left; white arrow). The values of fluorescence intensity are plotted UdgX and RPA (B), UdgX and A3A (C) and RPA and A3A (D). Regions in this scan where the intensities of a pair of fluorophores change in opposite directions are indicated by red bars below each plot (C and D, graphs on the right).

