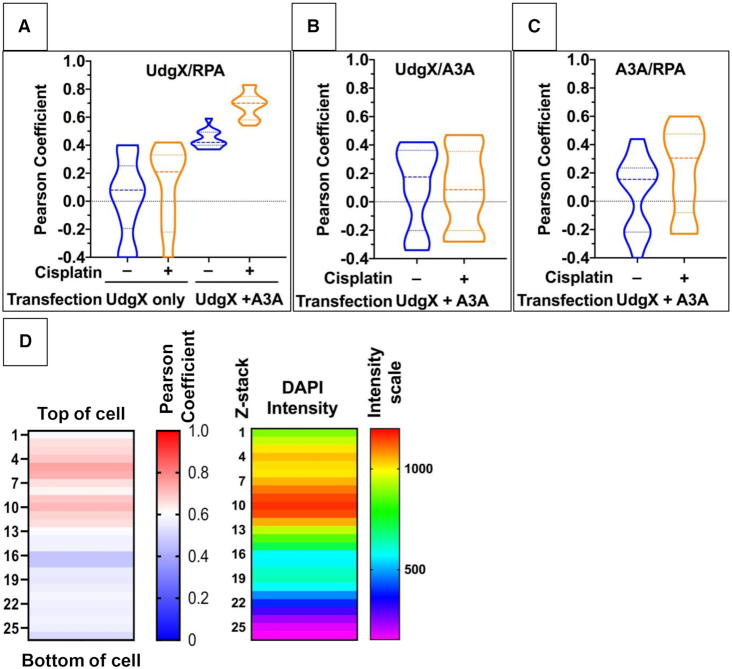
Figure 7.
Correlation between localization of RPA and UdgX. HEK293T cells were transfected with pFLAG-UdgX and/or pFLAG-A3A-EGFP and the cells were either treated with cisplatin or were untreated. Fluorescence intensities were determined for UdgX, A3A and RPA across one focal plane for multiple cells and the Pearson correlation coefficient was determined for each pair of fluorophores using FIJI Colc2 software. The median values of correlations are shown by dashed lines while the upper and lower quartiles are marked by dotted lines. Transfected plasmid(s) and cisplatin treatment condition are shown below each plot. The different correlation analyses are- UdgX and RPA (A); UdgX and A3A (B) and A3A and RPA (C). (D) The cell profiled in Figure 6 was divided into 26 × 0.15 micron z-stacks, and the fluorescence intensities were determined across each z-stack. The Pearson coefficients were calculated for UdgX and RPA signals at each stack and is shown as a heatmap. DAPI signal intensity at each slice is also shown as a heatmap to identify the position of the nucleus in the cell.

