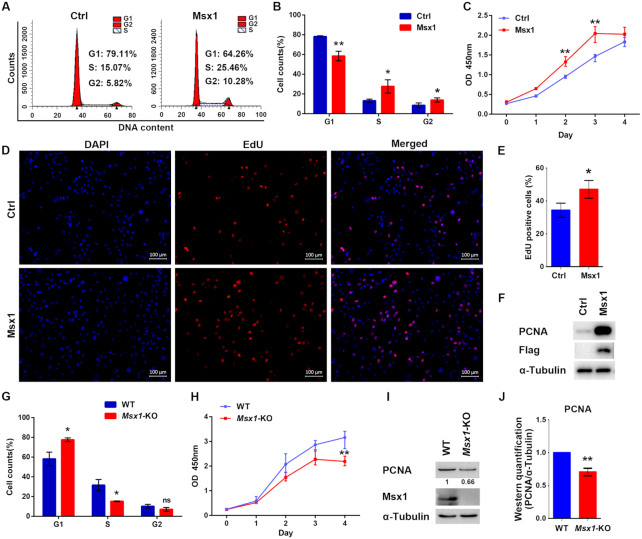
Figure 1.
Msx1 promotes C2C12 cell proliferation. (A) Flow cytometry assays to assess the impact of Msx1 on C2C12 cell cycle progression. (B) Statistical analysis of the cell cycle of C2C12 cells overexpressing Msx1 or the control. Values are the means ± SD. **P < 0.001, *P < 0.01. (C) CCK-8 assays to assess the proliferation rate of C2C12 cells overexpressing Msx1 or the control. Values are the means ± SD. **P < 0.001. (D) EdU assays to evaluate the effect of Msx1 on C2C12 cell proliferation. Scale bar = 100 μm. (E) Quantification of the ratio of proliferating cells to total cells in EdU assays. Values are the means ± SD. *P < 0.01. (F) Western blotting to detect the expression of PCNA in C2C12 cells overexpressing Msx1 and the control. (G) Statistical analysis of the cell cycle of Msx1-KO or wild-type C2C12 cells. Values are the means ± SD. *P < 0.01. (H) CCK-8 assays to assess the proliferation rate of Msx1-KO or wild-type C2C12 cells. Values are the means ± SD. **P < 0.001. (I) Western blotting to detect the expression of PCNA in Msx1-KO or wild-type C2C12 cells. Numbers under western blot bands represent relative quantifications over α-Tubulin quantified by ImageJ software. Statistical analysis of western blot gray scale values is shown in (J) (n = 3, wild-type was set as 1). Values are the means ± SD. **P < 0.001.

