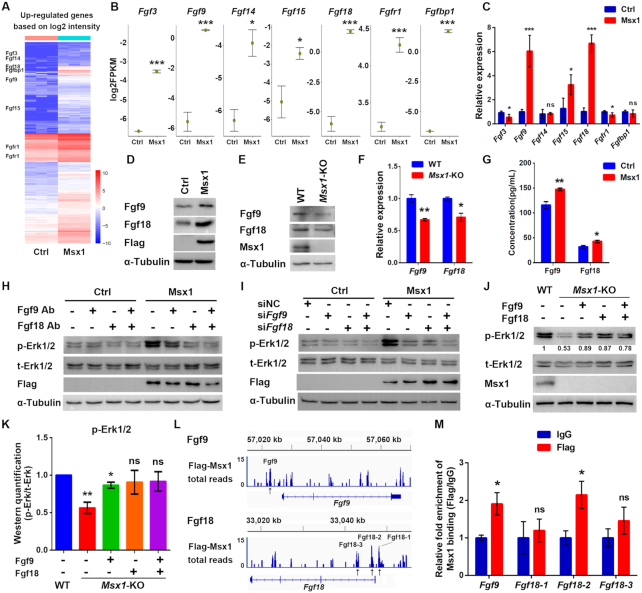
Figure 3.
Msx1 directly binds to and upregulates Fgf9 and Fgf18 to activate the MAPK signaling pathway. (A) Heatmap of upregulated genes based on the RNA-seq data (n = 3). Selected upregulated genes are indicated. (B) Diagrams of the upregulated genes that activate the MAPK signaling pathway based on the RNA-seq data. Values are the means ± SD. ***P < 0.0001, *P < 0.01. (C) qRT-PCR assays to validate the upregulated genes that activate the MAPK signaling pathway based on the RNA-seq data. Values are the means ± SD. ***P < 0.0001, *P < 0.01. (D) Western blotting to confirm the upregulation of Fgf9 and Fgf18 by Msx1. (E) Western blotting to confirm the downregulation of Fgf9 and Fgf18 by Msx1 knockout in C2C12 cells. (F) qRT-PCR assays to determine the mRNA levels of Fgf9 and Fgf18 in Msx1-KO C2C12 cells and the control cells. Values are the means ± SD. **P < 0.001, *P < 0.01. (G) ELISA assays to evaluate the impact of Msx1 on the secretion of Fgf9 and Fgf18 in C2C12 cells. C2C12 cells overexpressing Msx1 or the control were cultured overnight with serum-free DMEM and the supernatants were obtained and subjected to ELISA with the indicated kits. Values are the means ± SD. **P < 0.001, *P < 0.01. (H) Western blotting to detect the level of p-Erk1/2 when Fgf9 and/or Fgf18 protein was blocked. Antibodies against Fgf9 and/or Fgf18 were added to the medium of C2C12 cells at a dilution of 1:1000. After 24 h of incubation, cells were harvested and lysed for western blotting. (I) Western blotting to detect the effect of Fgf9 and/or Fgf18 knockdown on the level of p-Erk1/2. (J) Western blotting to examine the recovery of the p-Erk1/2 level induced by Fgf9 and Fgf18 in Msx1-KO C2C12 cells. Msx1-KO C2C12 cells treated with 50 ng/ml Fgf9 or/and Fgf18 recombinant protein for 24 h or control cells were harvested and lysed for western blotting. Numbers under western blot bands represent relative quantifications over t-Erk1/2 quantified by ImageJ software. Statistical analysis of western blot grey scale values is shown in (K) (n = 3, wild-type was set as 1). Values are the means ± SD. **P < 0.001, *P < 0.01. (L) Msx1 ChIP signal enrichment at Fgf9 and Fgf18 loci. ChIP assays were performed using C2C12 cells expressing Flag-tagged Msx1 or the control vector. The enriched regions from the Flag-Msx1 expressing cells were compared to an empirical background set of sequencing reads from a Flag immunoprecipitation performed on cells infected with an empty vector to exclude regions of the genome that may be non-specifically enriched by Flag immunoprecipitation. Black arrows indicate the possible Msx1 binding sites. (M) ChIP-qPCR analyses to validate the Msx1 binding at the Fgf9 and Fgf18 loci based on the ChIP-seq data. ChIP assays were performed with C2C12 cells overexpressing Flag-tagged Msx1 or control cells. ChIP-qPCR was then used to determine the relative enrichment of the Fgf9 and Fgf18 fragments based on the ChIP-seq performed with the same cell line C2C12 overexpressing Flag-tagged Msx1. The ChIP-qPCR data were analyzed to calculate the enrichment of Flag or IgG relative to input respectively, and IgG values were defined as 1 to calculate the fold enrichment of Flag over IgG. Values are the means ± SD. *P < 0.01.

