Figure 4.

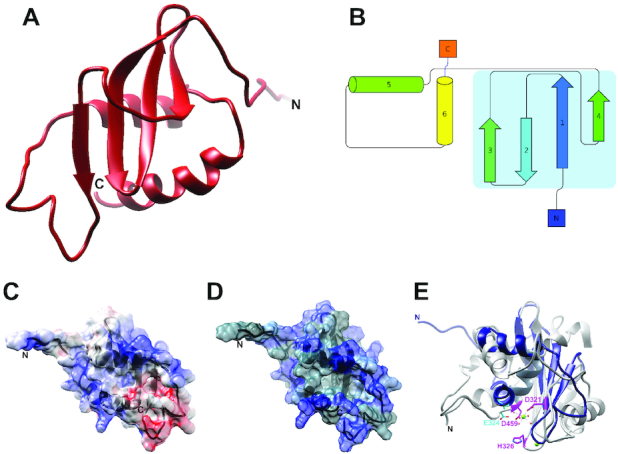
CTD Structure and Surface Properties. (A) Ribbon diagram of the lowest energy structure in the ensemble. (B) Topology diagram of the CTD, with the central β-sheet outlined in light blue. (C) Electrostatic surface potential of the CTD. Red represents negatively charged patches and blue positively charged patches. (D) Hydrophobic surface map of the CTD. Blue represents polar residues, while gray represents hydrophobic regions. (E) Superposition of the CTD (blue) with the C-terminal nuclease domain from bacteriophage P22 (38) (gray; PDB 4DKW). Catalytic residues in P22 are colored pink. There is little apparent sequence homology of the catalytic/metal binding nuclease residues in the CTD; E324 from the CTD (shown in cyan) is the acidic residue nearest the P22 magnesium ion (shown in green), but does not correspond to any of the conserved catalytic/metal binding residues in the nuclease domain.
