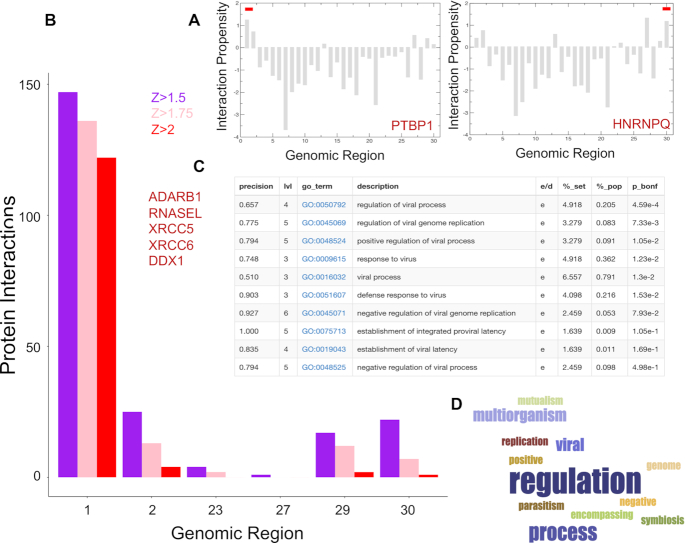
Figure 4.
Predictions of protein interactions with SARS-CoV-2 RNA. (A) In agreement with studies on coronaviruses (52), PTBP1 shows the highest interaction propensity at the 5′ and HNRNPQ at 3′ (indicated by red bars). (B) Number of RBP interactions for different SARS-CoV-2 regions (colours indicate catRAPID (18,19) confidence levels: Z = 1.5 or low Z = 1.75 or medium and Z = 2.0 or high; regions with scores lower than Z = 1.5 are omitted); (C) enrichment of viral processes in the 5′ of SARS-CoV-2 (precision = term precision calculated from the GO graph structure lvl = depth of the term; go_term = GO term identifier, with link to term description at AmiGO website; description = label for the term; e/d = enrichment / depletion compared to the population; %_set = coverage on the provided set; %_pop = coverage of the same term on the population; p_bonf = P-value of the enrichment. To correct for multiple testing bias, use Bonferroni correction) (28); (D) viral processes are the third largest cluster identified in our analysis;

