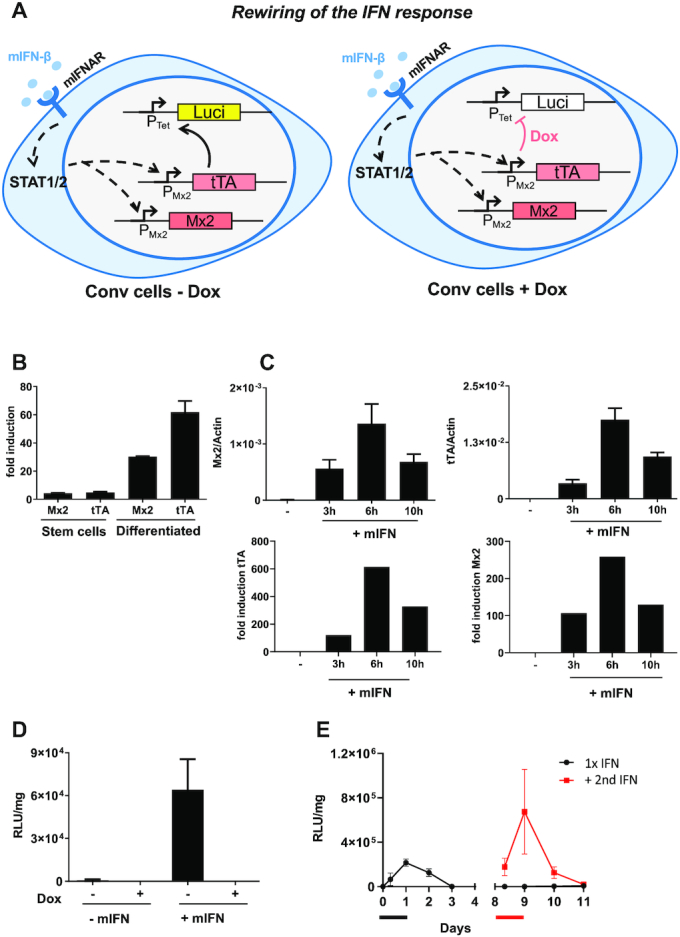
Figure 1.

mIFN-β and doxycycline-controlled expression in Conv cells. (A) Depiction of the intracellular circuit in Conv cells for rewiring and switching-off of expression in presence of doxycycline (Dox). The transcriptional activator tTA is integrated downstream of the Mx2 promoter (Mx-tTA cells, see Supplementary Figure S1 for details) and expressed only upon stimulation of IFNAR with mIFN. tTA binds to its cognate PTet promoter and activates luciferase expression. Doxycycline blocks binding of tTA and thereby switches off expression. Coloured boxes indicate induced genes upon IFN stimulation, white boxes indicate the situation in the repressed state (+Dox). (B) Relative Mx2 and tTA mRNA levels were determined in Mx-tTA embryonic stem cells and in in vitro-differentiated primary cells derived thereof. Upon stimulation of cells with 500 U/ml mIFN-β for 24h, mRNA was isolated. Mx2, tTA and actin levels were quantified by RT-qPCR. The fold induction of induced vs. non-induced cells is depicted. The presented data were derived from a single experiment done in triplicates. Mean values (C) mRNA levels of Mx2 and tTA were determined upon stimulating MxtTA cells with 50 U/ml mIFN-β for the indicated time. The relative expression in relation to actin is shown. The presented data are based on five samples derived from two independent experiments. (D) Luciferase expression upon stimulating Conv cells with 500 U/ml mIFN-β for 24 h in presence and absence of Doxycycline. Luciferase was analysed after withdrawal of mIFN. The presented data are based on six samples derived from two independent experiments. (E) Kinetics of luciferase expression in Conv cells. Cells were transiently stimulated with 500 U/ml IFN-β for 24 h and then analysed over time (black line). A fraction of cells was restimulated on day 8 with 500 U/ml mIFN-β for 24 h and monitored (red line). The time of first and second mIFN-β induction is represented by the black and red bars. The presented data were derived from a single experiment out of several other experiments with comparable settings and was performed in triplicates.
