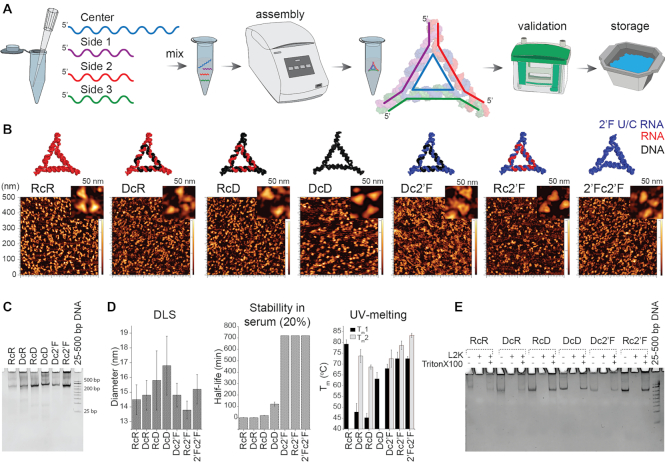
Figure 1.
Assembly of NANPs and their physicochemical characterization. (A) A schematic of the assembly, conformation, and validation of NANPs. (B) Energy minimized 3D models of the NANPs and their corresponding AFM images. (C) Confirmation of assembly confirmed by EtBr total staining native-PAGE (representative gel). (D) Relative sizes of NANPs assessed by DLS, chemical stability of NANPs incubated in 20% FBS solution at 37°C from 1 to 720 min analyzed by EMSA, and melting temperatures assessed by UV-melting experiment. (E) Structural integrity of NANPs upon release from Lipofectamine 2000 (L2K) complexation confirmed by EtBr total staining native-PAGE (representative gel). Data are represented as the mean ± (SEM) for a minimum of three independent experimental replicates. The error for Tm and blood stability did not exceeded 10%. For C and E, 25–500 bp Low Range DNA Marker A (Biobasic) was used as the control.

