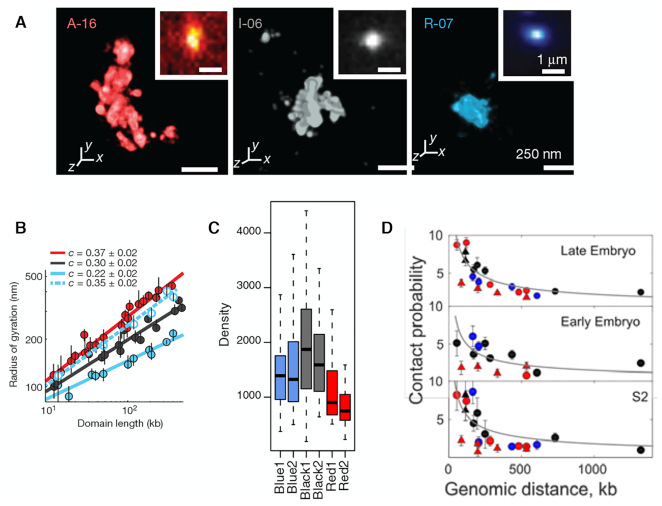
Figure 1.
Super-resolution imaging data from the three different studies. (A) Three epigenetic domains visualized by Boettiger et al. From the left to the right shown are the image of A-16 (active), I-06 (inactive), and R-07 (repressed) domains. (B) The radius of gyration for each of three domain types shown in (A) as a function of domain length. The data in blue fitted to dashed line is for the Ph knocked-down repressed domains. The figures in (A) and (B) were both taken from Ref. (13). (C) Density of three types of epigenetic domains. Blue, black and red correspond to the R-, I- and A-domains, respectively. The figure was taken from Figure 1H in Szabo et al. (14). (D) Contact probability as a function of genomic distance. The figure was taken from Supplementary Figure S2C in Cattoni et al. (27).

