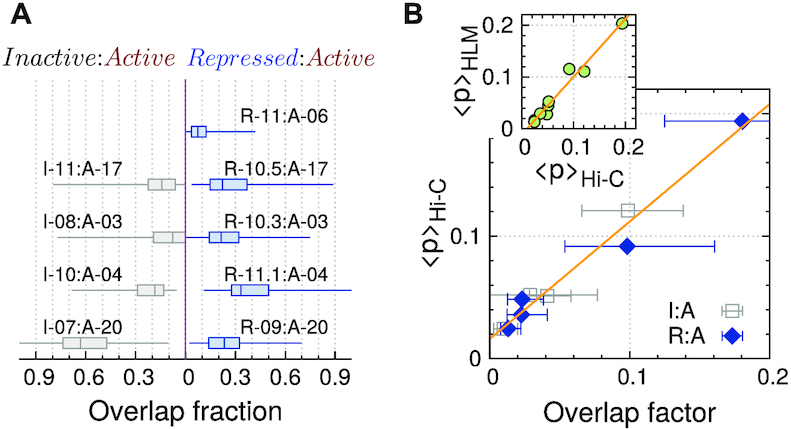
Figure 6.

Comparison of spatial overlap of inactive and repressed domains with adjacent active domains. (A) Overlap fraction. (B) The inter-domain mean contact probability measured from Hi-C, 〈p〉Hi-C, versus overlap factor (corr. =0.99). (Inset) 〈p〉Hi-C is plotted against the same quantity measured from chromosome models 〈p〉HLM (corr. = 0.98).
