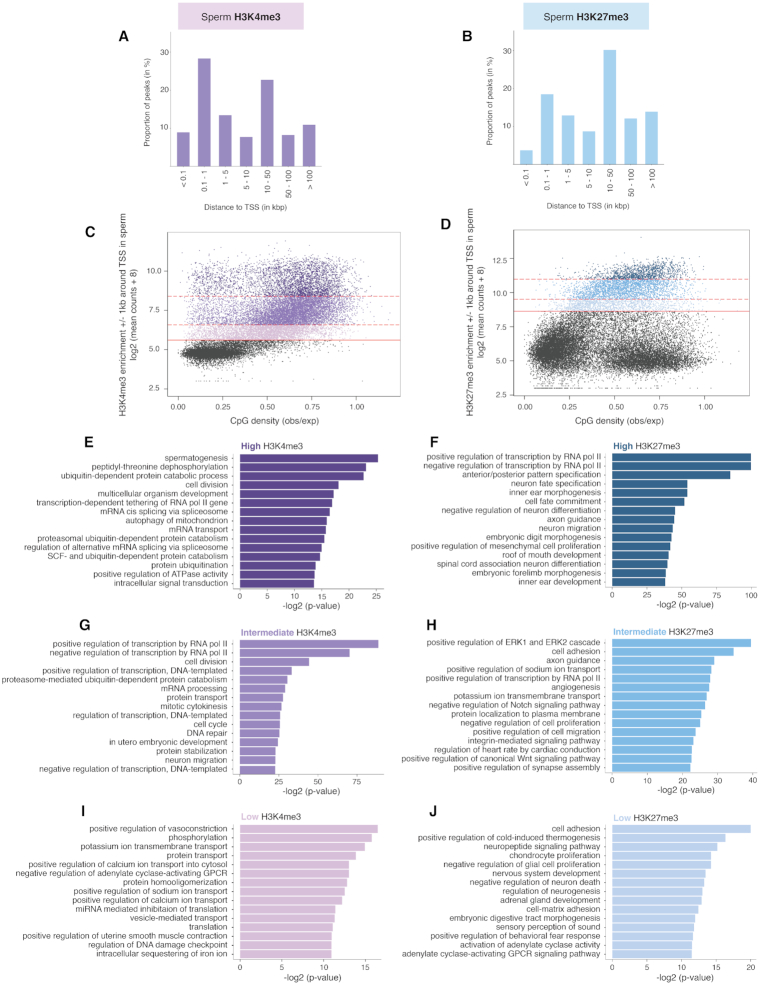
Figure 2.
Sperm H3K4me3 and H3K27me3 are differentially distributed across the genome and are associated with different functional roles. (A) Proportion of H3K4me3 peaks in control wildtype (CRwt) sperm relative to the nearest transcriptional start site (TSS). (B) Proportion of H3K27me3 peaks in CRwt sperm relative to the nearest TSS. (C and D) Scatterplots corresponding to the log2 (mean of CRwt ChIP-Seq read counts + 8) ± 1 kb around the TSS of all known genes in the mouse genome for (C) sperm H3K4me3 and (D) sperm H3K27me3, against the CpG density of the regions (observed CpG / expected CpG). Solid red line indicates the minimum count threshold that separates enriched windows (blue) from background (black) (Supplementary Figure S3A and B; see Methods). Counts at promoter regions marked by H3K4me3 or H3K27me3 in sperm were classified into low, intermediate, and high enrichment levels based on quartile distribution cutoffs (dotted red lines separate the different quarters; see Methods). (E, G, I) Top significant pathways from gene ontology analysis on promoters of high (E), intermediate (G), and low (I) H3K4me3 enrichment quarters. (F, H, J) (see also Supplementary Table S3A-C). Top significant pathways from gene ontology analysis on promoters of high (F), intermediate (H), and low (J) H3K27me3 enrichment quarters (see also Supplementary Table S3D–F).

