Figure 4.
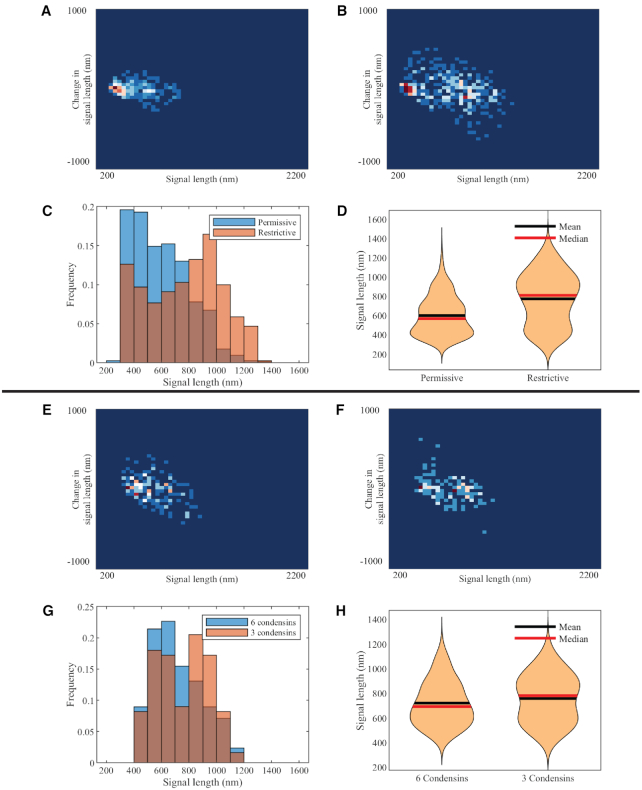
Experimental and simulated plasmid signal lengths versus condensin perturbations. Density heatmap of condensin TS mutant, ycg1–2, at permissive (A) and restrictive (B) temperatures. Combined signal length histograms (C) and signal length violin plots (D) of condensin TS mutant, ycg1–2, at permissive and restrictive signals. Density heatmap of simulated plasmids with six condensins (E) and three condensins (F). Combined signal length histograms (G) and signal length violin plots (H) of simulated plasmids with six condensins and three condensins, respectively.

