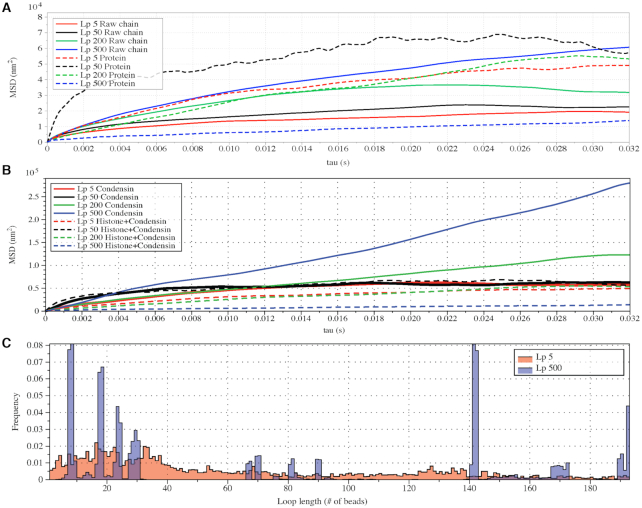
Figure 6.
Varying DNA stiffness leads to non-monotone performance of hierarchical loop structures caused by histones and condensins. (A) Simulated MSD plot as a function of τ.  varies from 5 to 500 nm. Solid lines correspond to simulations without both histones and condensins. Dashed lines demonstrate statistics of simulation results with both histones and condensins. (B) Simulated MSD plot as a function of τ.
  varies from 5 to 500 nm. Solid lines correspond to simulations without histones. Dashed lines demonstrate statistics of simulation results with both histones and condensins. (C) Cumulative distribution in the sizes of loops for condensin loops, compared between highly flexible chains in red (
 ) and stiffer chains in blue (
 ).
).

