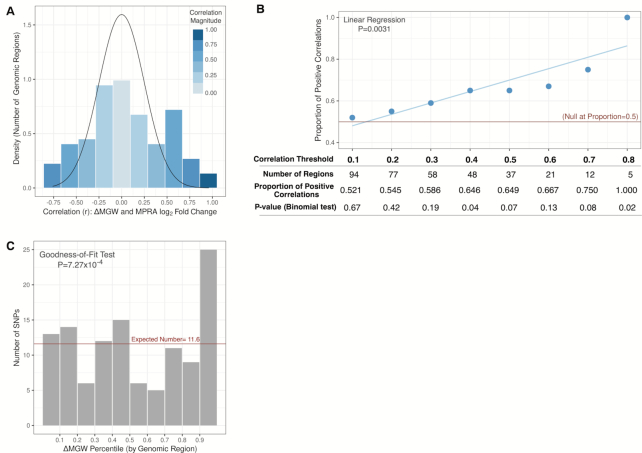
Figure 5.
Correlation between ΔMGW and allele-specific activity as measured by log2 fold change in a Massively Parallel Reporter Assay. (A) Correlations between ΔMGW and log2 fold change for SNPs (n = 116 genomic regions. Distribution of correlation estimates (r) shows enrichment for genomic regions exhibiting large positive correlations between magnitude of allele-specific activity and magnitude of ΔMGW. (B) The proportion of positive correlations between log2 fold change and ΔMGW shows enrichment at increasing thresholds of correlation estimates. Under null the null hypothesis we would expect to see equivalent (0.5) proportion of negative and positive correlation estimates at any threshold of r, shown as a red line. Here, we see enrichment of positive correlations. Globally, there is a significant (P = 0.0031) trend with increasing r thresholds, up to r = 0.8 where all five regions show positive correlation between ΔMGW and allele-specific activity. (C) Regional ΔMGW percentile for SNPs showing the greatest allele-specific activity in 116 genomic regions. For each region, we summarized the relative ΔMGW for the SNP with the largest magnitude of log2 fold change. Under the null (no relationship between ΔMGW and allele-specific activity), we would expect a uniform distribution of ΔMGW with an expected value of 11.6 per bin (116/10). Instead, we observe significant departure from the uniform distribution based on a chi-squared goodness-of-fit test (P = 0.0007). There was strong enrichment for SNPs (with the greatest allele-specific activity) to also exhibit the largest magnitude of ΔMGW in the region.

