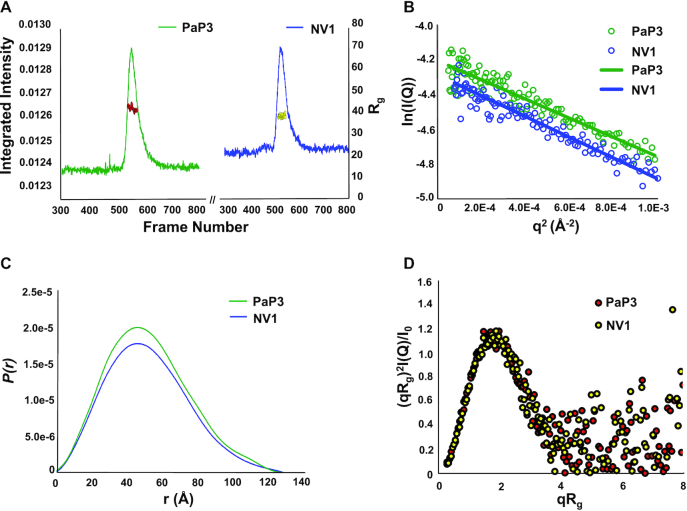
Figure 4.
SEC-SAXS analysis of PaP3 and NV1 TerSs. (A) SEC-SAXS profile of PaP3 TerS at 1.7 mg ml−1 and NV1 TerS at 2.0 mg ml−1 measured in 20 mM Tris–HCl pH 8.0, 0.15 M NaCl, 2.5% glycerol and 0.5 mM TCEP at 4°C. The red dots and yellow dots indicate Rg values (on the y-axis) corresponding to frames (x-axis) for PaP3 TerS and NV1 TerS, respectively. (B) PaP3 TerS Guinier plots calculated from averaging buffer-subtracted scattering intensities from frames (495–514) and the sample peak (547–564) (green dots). The PaP3 TerS coefficient of determination for line of best fit, R2, is 0.8942 (green line). NV1 TerS Guinier plots calculated from averaging buffer-subtracted scattering intensities from frames (280–299) and the sample peak (523–542) (blue dots). The NV1 TerS coefficient of determination for line of best fit, R2, is 0.9267 (blue line). (C) P(r) function (D) and dimensionless Kratky plot calculated from SEC-SAXS data.

