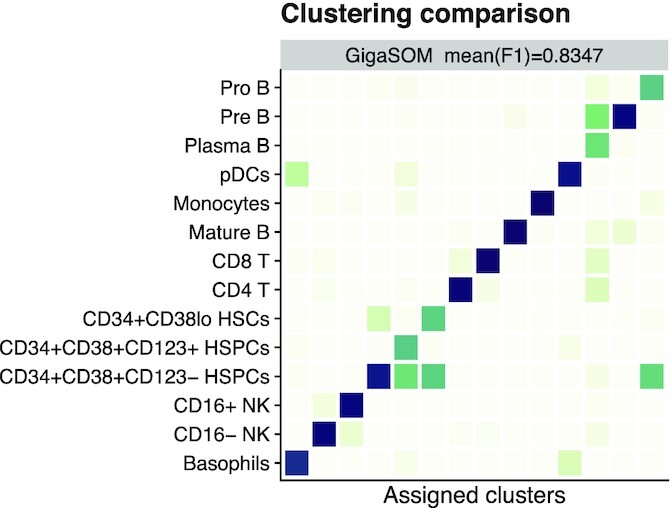
Figure 2.

Comparison of GigaSOM.jl results with manual gating of the Levine32 dataset. The confusion matrix is normalized in rows, showing the ratio of cells in each aggregate of GigaSOM-originating clusters that matches the cell types from manual analysis. Darker color represents better match. The mean F1 score is comparable to FlowSOM. A more comprehensive comparison is available in Supplementary Fig. S1.
