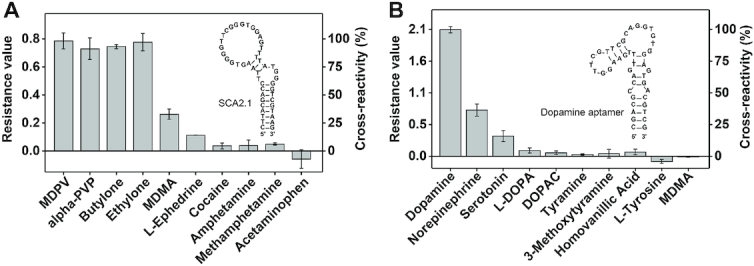
Figure 5.

Ligand binding profile of aptamers with G-quadruplexes as determined using the exonuclease-based profiling assay. Resistance values and cross-reactivity of (A) SCA2.1 for each ligand relative to MDPV and (B) of the dopamine-binding aptamer for each ligand relative to dopamine. Error bars represent the standard deviation of three experiments.
