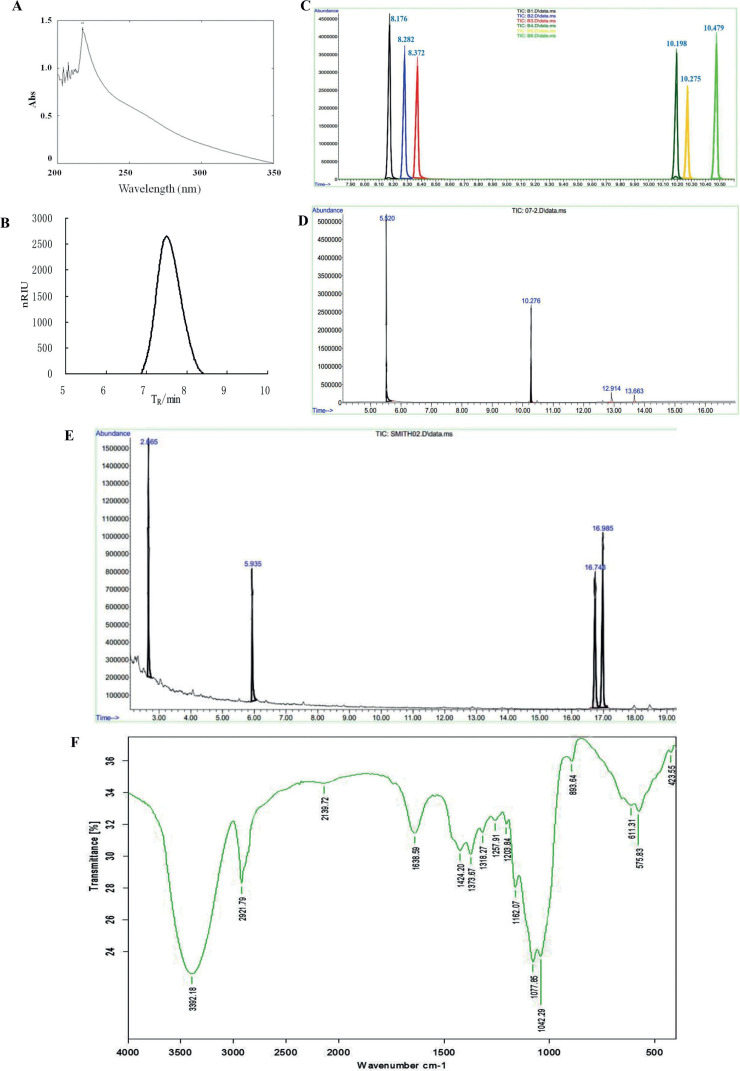
Fig. 1.
Determination of purity and chemical analyses of WEP1. (A) UV spectrum of WEP1. (B) Chromatogram of WEP1 for molecular weight determination. (C) GC of standard monosaccharides’ derivatives. (D) GC of WEP1’s derivatives. (E) GC of smith degradation for WEP1. (F) FT-IR spectrum of WEP1 in the range of 4,000–400 cm−1.

