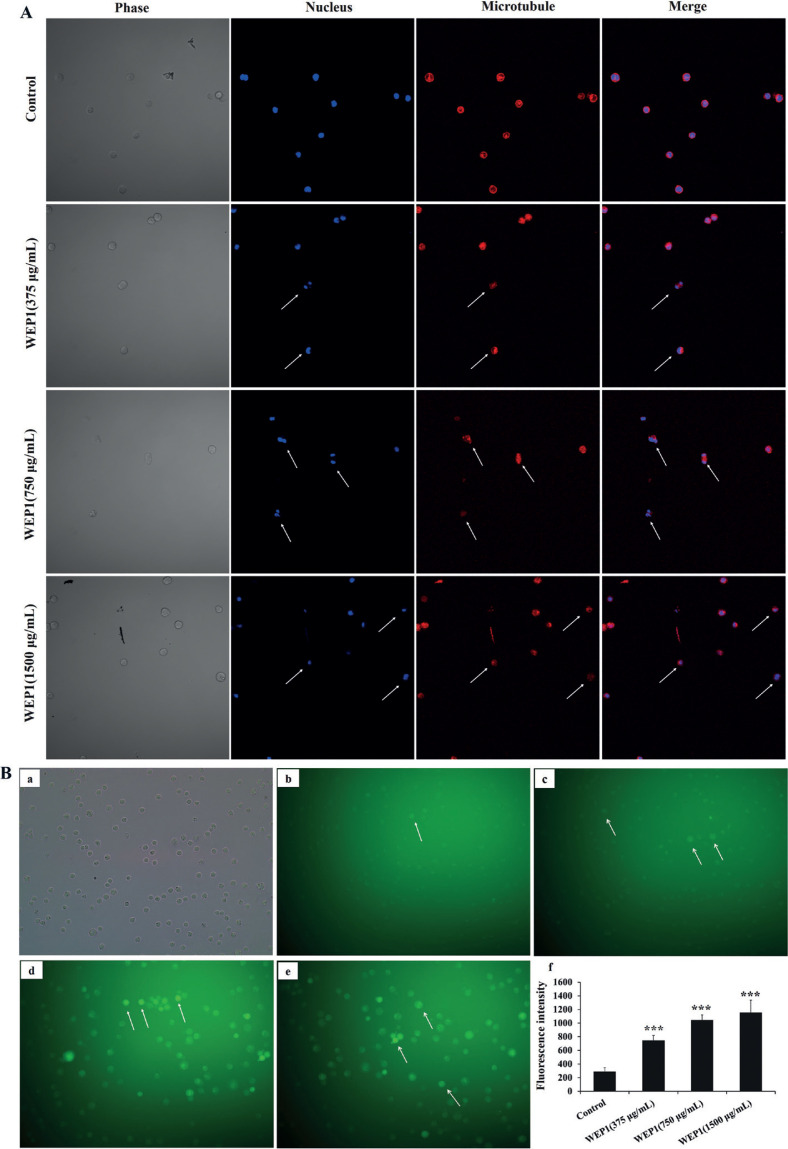
Fig. 3.
Effects of WEP1 on the inhibition of tubulin polymerization and the levels of intracellular ROS in H22 cells. (A) Disruption of microtubule network in response to WEP1-treated H22 cells was observed under LSCM. Changes were marked with arrows. (B) (a–e) Representative images of ROS fluorescence in different groups: (a) light microscope image of H22 cells; (b) control; (c–e) cells treated with different concentrations of WEP1 (375, 750, and 1,500 μg/mL). (f) Fluorescence intensity of H22 cells. Values were expressed as means ± SD from three independent experiments. ***P < 0.001 compared with control group.

