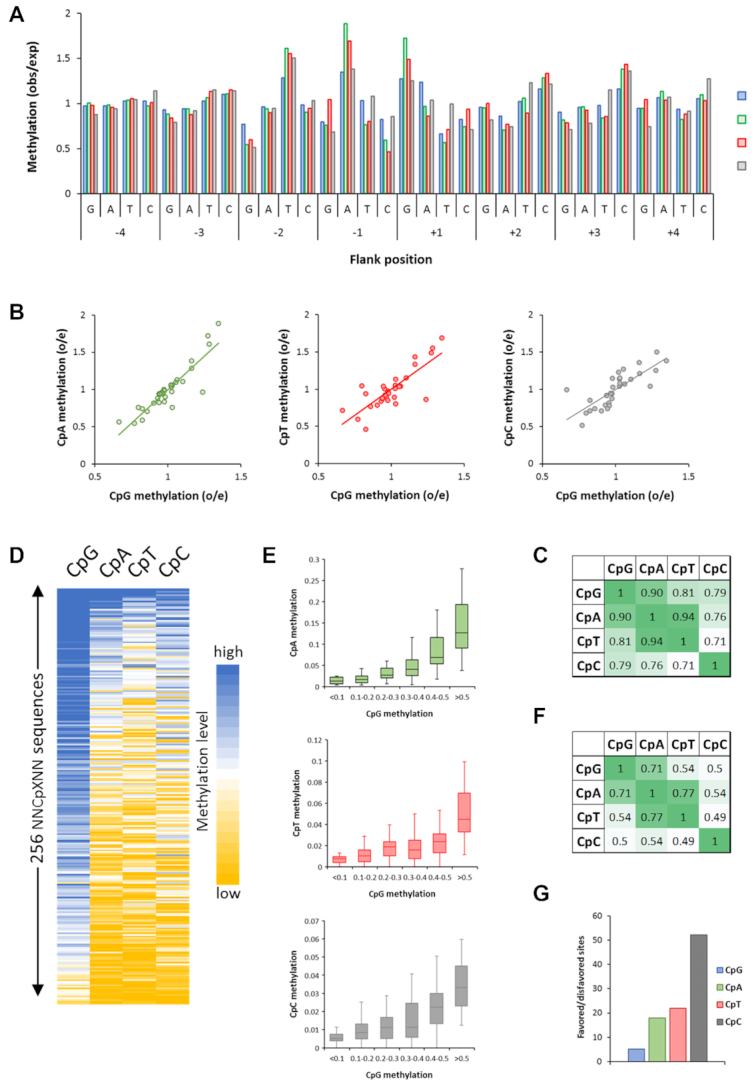
Figure 3.

Global analysis of flanking sequence effects on CpG and non-CpG methylation by wildtype DNMT3B showing overall correlations of CpX methylation. (A) Average CpX methylation levels of all substrates containing specific bases at –4 to +4 flank positions. Methylation levels are given as observed/expected (obs/exp) values. (B) Correlation of non-CpG and CpG –4 to +4 flanking sequence preferences. (C) Pearson correlation factors of the different CpX methylation flanking sequence profiles. (D) Global correlation of CpX methylation in 256 NNCXNN sequences. (E) Boxplot showing the correlation of CpG and non-CpG methylation levels of NNCXNN sequences. The boxes display the first and third quartiles with medians indicated by vertical lines. Whiskers display the data range. (F) Pearson correlation factors of the flanking preferences of all types of CpG and non-CpG methylation. (G) Ratio of the average methylation rates of the 15% most preferred and most disfavored flanking sites for CpG and CpN methylation.
