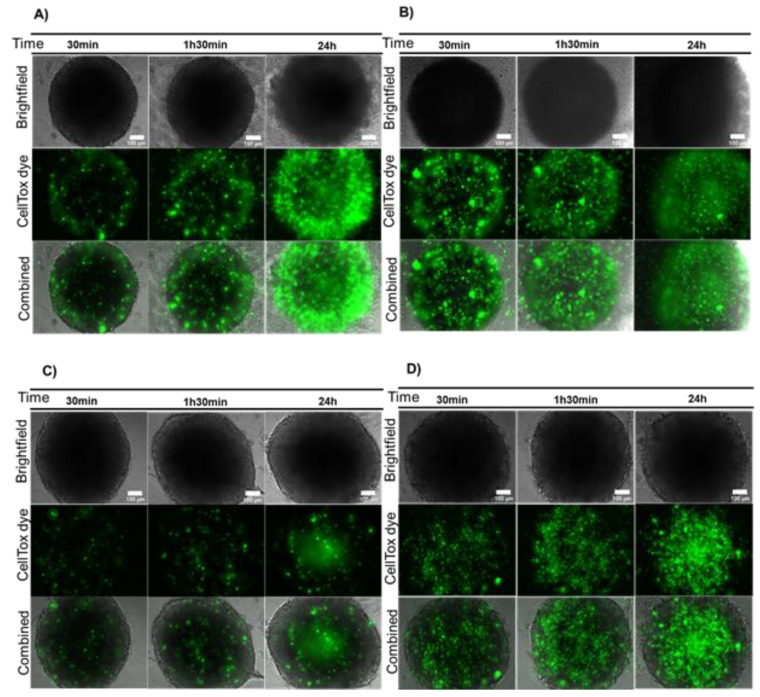
Figure 1.
AuNP@PEG effect on cell viability measured by CellTox green dye. (A) HCT116 spheroids incubated for 24 h with 8 nM AuNP@PEG; (B) HCT116-DoxR spheroids incubated for 24 h with 8 nM AuNP@PEG; (C) HCT116 spheroids alone; (D) HCT116-DoxR spheroids alone. Microscopy images were acquired in Brightfield or with a green fluorescence filter to evaluate CellTox green dye fluorescence, after 30 min, 1 h 30 min or 24 h incubation. The combined images result from the overlap between Brightfield and green filter images. Scale bar corresponds to 100 μm.

