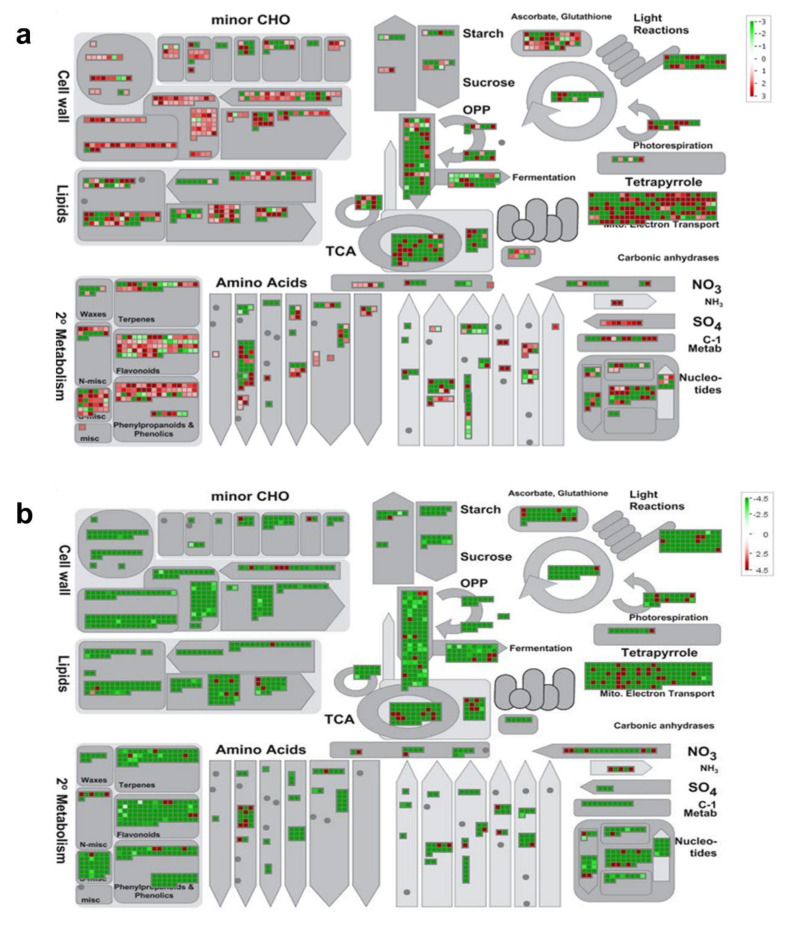
Figure 4.
MapMan metabolic overview of aluminum-stress-responsive genes in sugarcane cultivars (a) TAS and (b) SAS. The analysis was performed using MapMan v.3.5.0. Small squares represent Log2 expression values of stress-responsive genes. The color key represents the RPKM (reads per kilobase million)—normalizes Log3-transformed counts. Red represents the upregulated and green the downregulated genes in response to aluminum stress.

