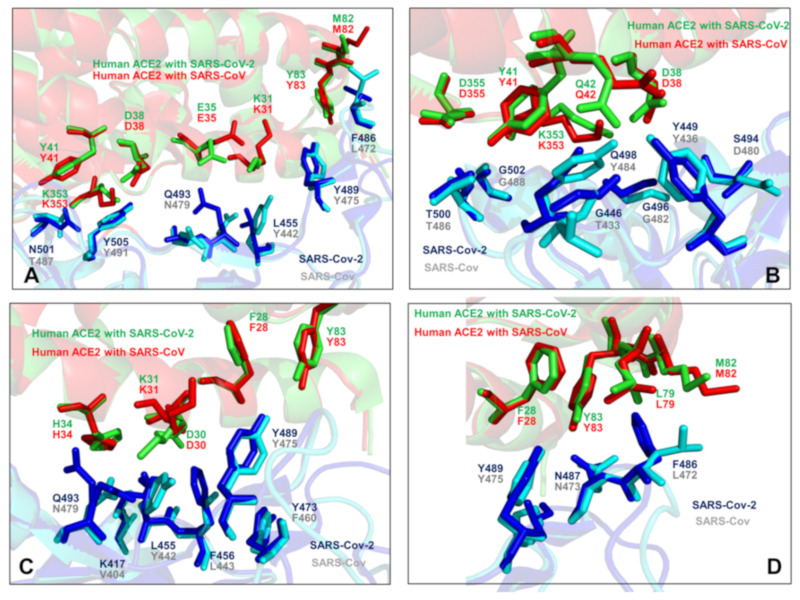
Figure 3.
An overview of the binding interface residues in the SARS-CoV-RBD and SARS-CoV-2-RBD complexes with human ACE enzyme. The minimized average equilibrium structures obtained from MD simulations are used to depict the binding interface regions and highlight small conformational changes. (A) The N-terminus segment of the interface is shown. The SARS-CoV-RBD residues T487, Y491, N479, Y442, Y475, and L472 from the complex with ACE2 are shown in cyan sticks. The corresponding SARS-CoV-2-RBD residues N501, Y505, Q493, L455, Y489, and F486 are shown in blue sticks. (B) Another binding interface region is shown with SARS-CoV-RBD residues T486, G488, T433, G482, Y484, Y436, and D480 (cyan sticks). The corresponding SARS-CoV-2-RBD residues T500, G502, G446, G496, Q498, Y449, and S494 are shown in blue sticks. (C) The central segment of the binding interface with SARS-CoV-RBD residues N479, V404, Y442, L443, F460, and Y475 (cyan sticks). The SARS-CoV-2-RBD residues are Q493, K417, L455, F456, Y473, and Y489 (blue sticks). (D) The binding interface flexible ridge with SARS-CoV-RBD residues Y475, N473, and L472 (cyan sticks) and SARS-CoV-2-RBD residues Y489, N487, and F486 (in blue sticks). In all panels ACE2 interacting residues are annotated and shown in red sticks for the SARS-CoV-RBD complex and green sticks for the complex with SARS-CoV-2-RBD.

