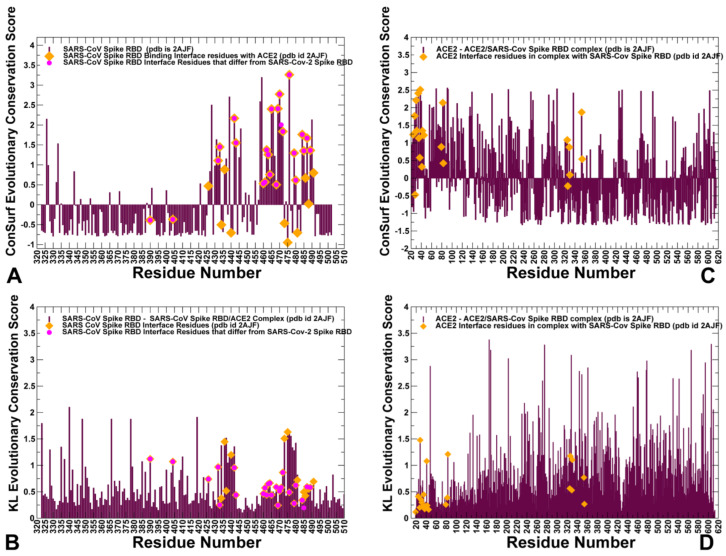
Figure 4.
Sequence conservation profiles of the SARS CoV and ACE2 proteins. (A) The normalized ConSurf conservation scores for SARS-CoV-RBD spike protein are projected onto the SARS-CoV-RBD complex with ACE2 (residue numbering as in pdb id 2AJF). The ConSurf profiles are shown in maroon bars. The negative ConSurf scores correspond to highly conserved sites (with ConSurf score < 0), and high positive scores (Consurf score > 1.0) depict highly variable positions. Consurf score = 1.0 is defined as a threshold for differentiating moderately and highly variable positions. The binding interface residues with ACE2 are highlighted in orange filled diamonds. The position of the binding interface residues that differ between SARS-CoV-RBD and SARS-CoV-2-RBD are shown in smaller magenta filled circles. (B) The KL conservation score for SARS-CoV-RBD spike protein. High KL scores indicate highly conserved sites (above threshold of KL=1.0) and low scores correspond to more variable positions. The annotation of the binding interface residues is as in panel A. (C) The normalized ConSurf conservation scores for ACE2 residues (residue numbering corresponds to ACE2 structure in complexes with SARS-CoV (pdb id 2AJF) and SARS-CoV-2 (pdb id 6M0J). The ACE2 binding interface residues are highlighted in orange filled diamonds. (D) The KL conservation score for ACE2 residues. The ACE2 binding interface residues are highlighted in orange filled diamonds.

