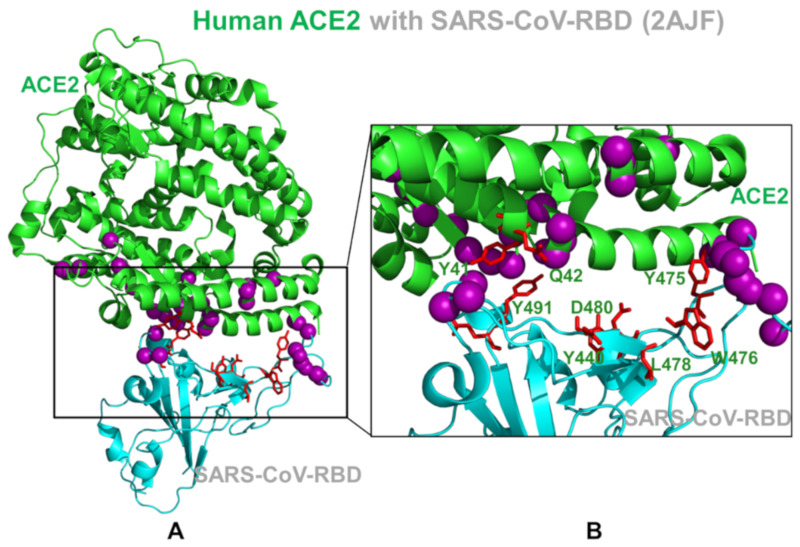
Figure 6.
Structural mapping of the SARS-CoV-RBD and ACE2 residues with high pMI and cMI values. (A) A general overview of the SARS-CoV-RBD complex with ACE2. The high pMI residues serving as regulators of coevolutionary network are shown in pink spheres. The highly coevolving residues with high cMI values are shown in red sticks. Note a consolidation of regulatory high pMI sites in the central segment of the binding interface and clusters of highly coevolving residues near the flexible loop regions of the binding interface. (B) A close-up of the binding interface between SARS-CoV-RBD and ACE2. The high pMI residues (pink spheres) and high cMI residues (red sticks) are shown and annotated for the key positions that control coevolutionary couplings in the complex.

