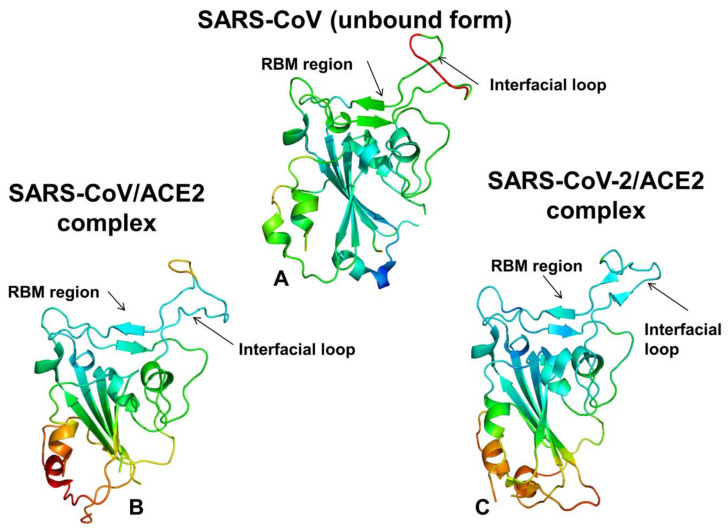
Figure 9.
Structural mapping of the conformational mobility profiles in the SARS-CoV unbound structure and SARS-CoV-RBD/SARS-CoV-2 RBD complexes with ACE2 obtained from all-atom MD simulations. (A) Conformational dynamics profiles mapped on the unbound form of SARS-CoV-RBD (pdb id 2GHV). A ribbon-based protein representation is used with coloring (blue-to-red) according to the protein residue motilities (from more rigid-blue regions to more flexible-red regions). (B) Structural map of the conformational mobility profile of SARS-CoV-RBD in the complex with ACE2. The more stable regions are shown in blue and more flexible are in green-to-red coloring scale. (C) Structural map of dynamics profile of SARS-CoV-2-RBD in the complex with ACE2. The more stable regions are shown in blue and more flexible are in green-to-red coloring scale. For each panel, the position of the RBM region and the interfacial loop, which is an element of the RBM, are indicated with respective arrows. Note the redistribution of conformational mobility between the unbound and bound forms for SARS-CoV and SARS-CoV-2.

