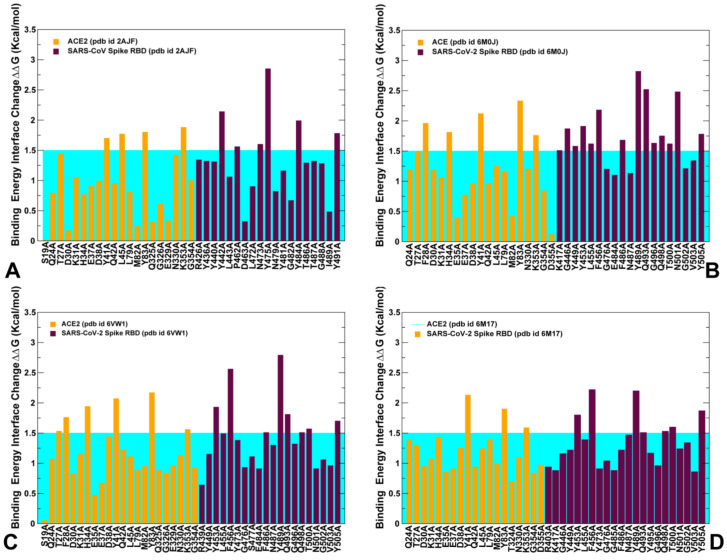
Figure 10.
Alanine scanning of the key binding interface residues in the SARS-CoV and SARS-CoV-2 complexes with ACE2. (A) The binding free energy changes upon alanine mutations for the interface residues in the SARS-CoV-RBD complex with ACE2 (pdb id 2AJF). The binding energy changes for the ACE residues are shown in orange bars and for the SARS-CoV-RBD interacting residues in maroon bars. The computed values were obtained using BeAtMuSiC approach and were averaged over equilibrium samples from MD simulation. (B) The binding free energy changes upon alanine mutations for the interface residues in the SARS-CoV-2 RBD complex with ACE2 (pdb id 6M0J). The binding energy changes for the ACE residues are shown in orange bars and for the SARS-CoV-2 RBD interacting residues in maroon bars. (C) The binding free energy changes upon alanine mutations for the interface residues in the engineered chimera SARS-CoV-2 RBD bound with ACE2 (pdb id 6VW1). The binding energy changes for the ACE residues are shown in orange bars and for the SARS-CoV-2 RBD interacting residues in maroon bars. (D) The binding free energy changes upon alanine mutations for the interface residues in the SARS-CoV-2 RBD complex with ACE2 obtained from the cryo–electron microscopy structure of the full-length human ACE2 with SARS-CoV-2 RBD in the presence of the neutral amino acid transporter B0AT1 (pdb id 6M17). The binding energy changes for the ACE residues are shown in orange bars and for the SARS-CoV-2 RBD interacting residues in maroon bars. The binding free energy changes for each complex are based on the average binding energy estimates over MD trajectories. The error bars for the binding free energy changes were in a small range of 0.05–0.15 kcal/mol. The horizontal lines on the graphs are materialized in cyan to indicate a threshold of 1.5 kcal/mol used to differentiate moderate and large free energy changes and identify key binding energy hotspots.

