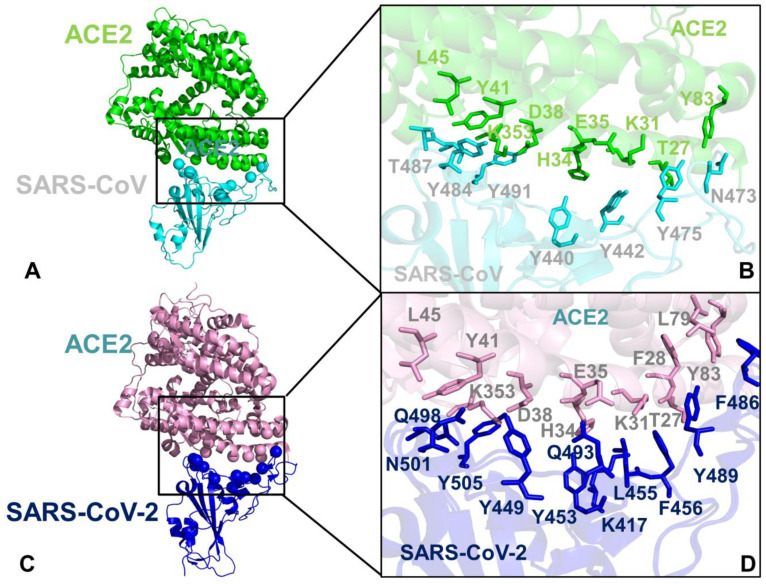
Figure 11.
Structural mapping of the binding energy hotspots in the SARS-CoV-RBD and SARS-Cov-2-RBD complexes with ACE2. (A) A general overview of the SARS-CoV-RBD complex with ACE2. SARS-CoV-RBD is shown in cyan ribbons and ACE2 is in green ribbons. The binding energy hotspots that experience significant loss of binding energy upon alanine mutations are shown in cyan spheres for SARS-CoV-RBD and in green spheres for ACE2. (B) A close-up of these binding energy hotspots in the SARS-CoV-RBD complex with ACE2. The SARS-CoV-RBD residues are annotated and shown in cyan sticks, ACE2 hotspot residues are in green sticks. (C) A general overview of the SARS-CoV-2-RBD complex with ACE2. SARS-Cov-2-RBD is shown in blue ribbons and ACE2 is in pink ribbons. The binding energy hotspots that experience significant loss of binding energy upon alanine mutations are shown in blue spheres for SARS-CoV-2-RBD and in pink spheres for ACE2. (D) A close-up of the binding energy hotspots in the SARS-CoV-2-RBD complex with ACE2. The SARS-CoV-RBD residues are annotated and shown in blue sticks, ACE2 hotspot residues are in pink sticks.

