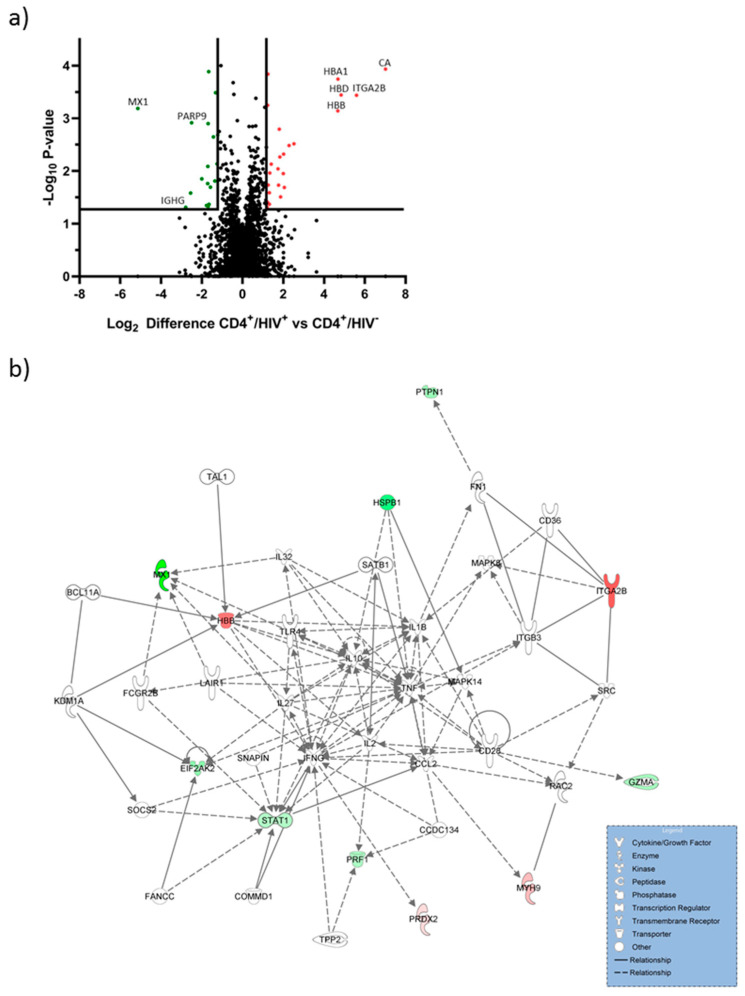
Figure 1.
Mass spectrometric analysis of the proteome of CD4+ T cells from therapy-naïve patients with HIV and CD4+/HIV− T cells. (a) Protein abundance in CD4+ T cells from therapy naïve-patients infected with HIV. Results are shown as a volcano plot. Protein abundance of three replicates is plotted as log2 value against the negative decadic logarithm of the p values. Proteins were regarded as regulated from factor 1.2 and p value < 0.05. Significantly upregulated proteins due to HIV infection are shown in red and downregulated proteins in green; (b) network analysis for up-and downregulated proteins are illustrated in green, not colored proteins were added by the IPA algorithm. High-confidence interactions are symbolized by a continuous line; medium-confidence interactions are symbolized by a dashed line.

